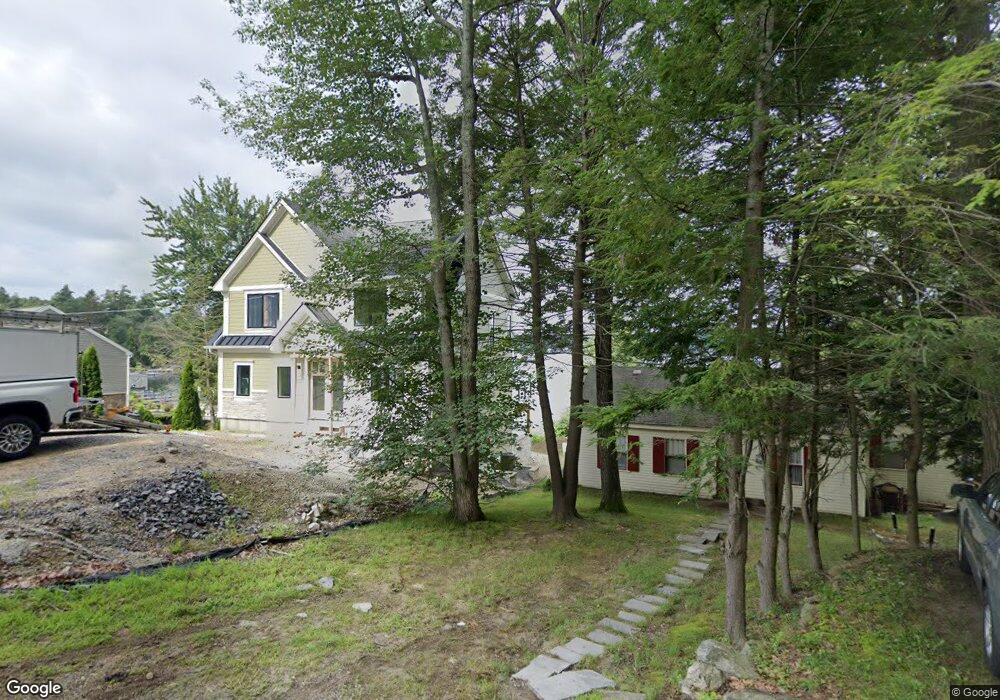
19 Farmer Rd Windham, NH 03087
Estimated Value: $1,183,000 - $1,976,000
3
Beds
5
Baths
2,860
Sq Ft
$527/Sq Ft
Est. Value
About This Home
This home is located at 19 Farmer Rd, Windham, NH 03087 and is currently estimated at $1,506,461, approximately $526 per square foot. 19 Farmer Rd is a home located in Rockingham County with nearby schools including Golden Brook Elementary School, Windham Middle School, and Windham High School.
Ownership History
Date
Name
Owned For
Owner Type
Purchase Details
Closed on
Dec 13, 2013
Sold by
Fnma
Bought by
Windbeam Loop Rt
Current Estimated Value
Purchase Details
Closed on
Mar 17, 2011
Sold by
Fnma
Bought by
Trapasso Philip J and Trapasso Bernadette
Purchase Details
Closed on
Mar 14, 2011
Sold by
Deluca William P and Deluca Kathleen M
Bought by
Finn Ft
Purchase Details
Closed on
Jul 20, 1982
Bought by
Finn Ft
Create a Home Valuation Report for This Property
The Home Valuation Report is an in-depth analysis detailing your home's value as well as a comparison with similar homes in the area
Home Values in the Area
Average Home Value in this Area
Purchase History
| Date | Buyer | Sale Price | Title Company |
|---|---|---|---|
| Windbeam Loop Rt | $101,300 | -- | |
| Trapasso Philip J | $122,500 | -- | |
| Finn Ft | $800,000 | -- | |
| Finn Ft | -- | -- |
Source: Public Records
Tax History
| Year | Tax Paid | Tax Assessment Tax Assessment Total Assessment is a certain percentage of the fair market value that is determined by local assessors to be the total taxable value of land and additions on the property. | Land | Improvement |
|---|---|---|---|---|
| 2024 | $23,097 | $1,020,200 | $535,500 | $484,700 |
| 2023 | $21,832 | $1,020,200 | $535,500 | $484,700 |
| 2022 | $20,159 | $1,020,200 | $535,500 | $484,700 |
| 2021 | $19,063 | $1,023,800 | $535,500 | $488,300 |
| 2020 | $19,585 | $1,023,800 | $535,500 | $488,300 |
| 2019 | $17,808 | $789,700 | $389,900 | $399,800 |
| 2018 | $18,392 | $789,700 | $389,900 | $399,800 |
| 2017 | $15,952 | $789,700 | $389,900 | $399,800 |
| 2016 | $17,231 | $789,700 | $389,900 | $399,800 |
| 2015 | $17,152 | $789,700 | $389,900 | $399,800 |
| 2014 | $18,653 | $777,200 | $402,000 | $375,200 |
| 2013 | $18,826 | $797,700 | $402,000 | $395,700 |
Source: Public Records
Map
Nearby Homes
- 6 Chadwick Cir
- 47 Cobbetts Pond Rd
- 5 Johnson St
- 54 Enterprise Dr
- 108 S Shore Rd
- 4 Arbor Rd
- 16 Arbor Rd
- 98 Trails Edge Rd
- 48 Marblehead Rd
- 6-18 Mary Anthony Dr
- 144 N Policy St
- 14 Londonderry Rd
- 39 Overton Rd
- 10 Harris Rd
- 47 Campbell St
- 56 Nelson St
- 11 Sullivan Ct
- 4 Rosemary St
- 30 Winter St
- 18 Winter St
Your Personal Tour Guide
Ask me questions while you tour the home.