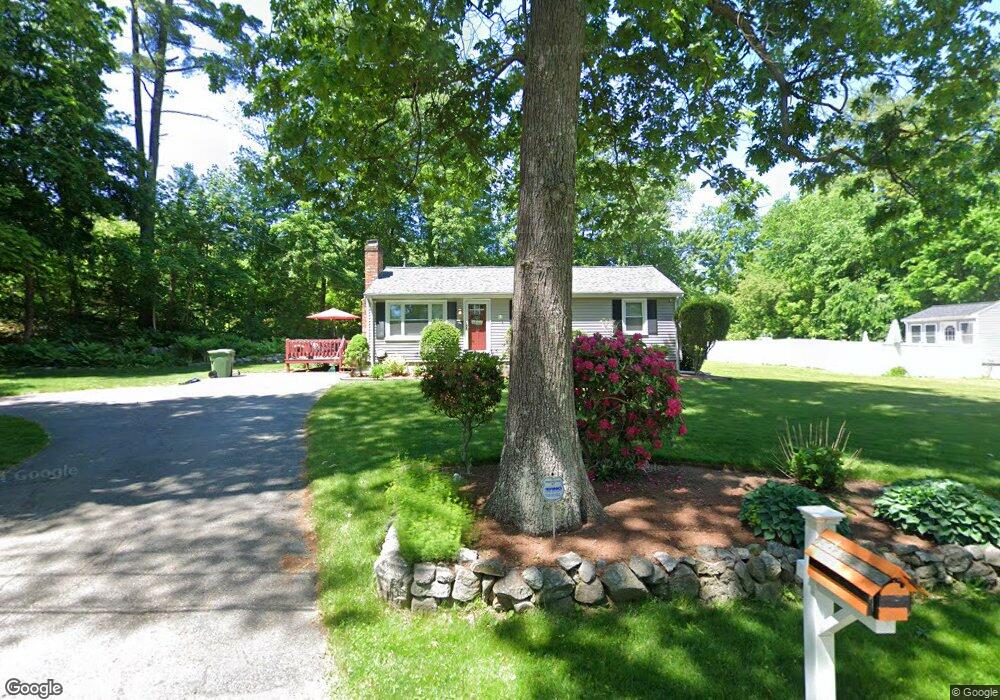
19 Farnum St Uxbridge, MA 01569
Estimated Value: $409,000 - $486,000
3
Beds
1
Bath
960
Sq Ft
$463/Sq Ft
Est. Value
About This Home
This home is located at 19 Farnum St, Uxbridge, MA 01569 and is currently estimated at $444,649, approximately $463 per square foot. 19 Farnum St is a home located in Worcester County with nearby schools including Uxbridge High School, Our Lady of the Valley Regional School, and Whitinsville Christian School.
Ownership History
Date
Name
Owned For
Owner Type
Purchase Details
Closed on
Jun 3, 2002
Sold by
Crossman David H and Crossman Sharon D
Bought by
Sanford Joseph and Sanford Michelle T
Current Estimated Value
Home Financials for this Owner
Home Financials are based on the most recent Mortgage that was taken out on this home.
Original Mortgage
$206,500
Outstanding Balance
$86,764
Interest Rate
7%
Mortgage Type
Purchase Money Mortgage
Estimated Equity
$357,885
Create a Home Valuation Report for This Property
The Home Valuation Report is an in-depth analysis detailing your home's value as well as a comparison with similar homes in the area
Home Values in the Area
Average Home Value in this Area
Purchase History
| Date | Buyer | Sale Price | Title Company |
|---|---|---|---|
| Sanford Joseph | $217,500 | -- |
Source: Public Records
Mortgage History
| Date | Status | Borrower | Loan Amount |
|---|---|---|---|
| Open | Sanford Joseph | $206,500 | |
| Previous Owner | Sanford Joseph | $87,900 |
Source: Public Records
Tax History Compared to Growth
Tax History
| Year | Tax Paid | Tax Assessment Tax Assessment Total Assessment is a certain percentage of the fair market value that is determined by local assessors to be the total taxable value of land and additions on the property. | Land | Improvement |
|---|---|---|---|---|
| 2025 | $4,435 | $338,300 | $132,600 | $205,700 |
| 2024 | $3,994 | $309,100 | $121,600 | $187,500 |
| 2023 | $3,723 | $266,900 | $110,500 | $156,400 |
| 2022 | $3,632 | $239,600 | $100,200 | $139,400 |
| 2021 | $3,721 | $235,200 | $95,800 | $139,400 |
| 2020 | $3,812 | $227,700 | $99,500 | $128,200 |
| 2019 | $3,779 | $217,800 | $92,100 | $125,700 |
| 2018 | $3,504 | $204,100 | $92,100 | $112,000 |
| 2017 | $3,202 | $188,800 | $85,900 | $102,900 |
| 2016 | $3,472 | $197,600 | $84,200 | $113,400 |
| 2015 | $3,405 | $195,700 | $84,200 | $111,500 |
Source: Public Records
Map
Nearby Homes
- 24 Road Ahr
- 48 Homeward Ave
- 72 Homeward Ave
- The Contemporary Villager Plan at Patriot's Landing
- Karenrose Sunnery Plan at Patriot's Landing
- 128 Mantell Rd
- 24 Olde Canal Way Unit 24
- 288 High St
- 20 Nature View Dr Unit 20
- 100 Spring Hill Dr Unit 100
- Layla Plan at Pine Ridge
- Ashley Plan at Pine Ridge
- Lily Plan at Pine Ridge
- Brooklyn Plan at Pine Ridge
- Tucker Plan at Pine Ridge
- Everleigh Plan at Pine Ridge
- 37 Elizabeth St
- 256 Mendon St
- 328 Millville Rd
- 36 Elm St