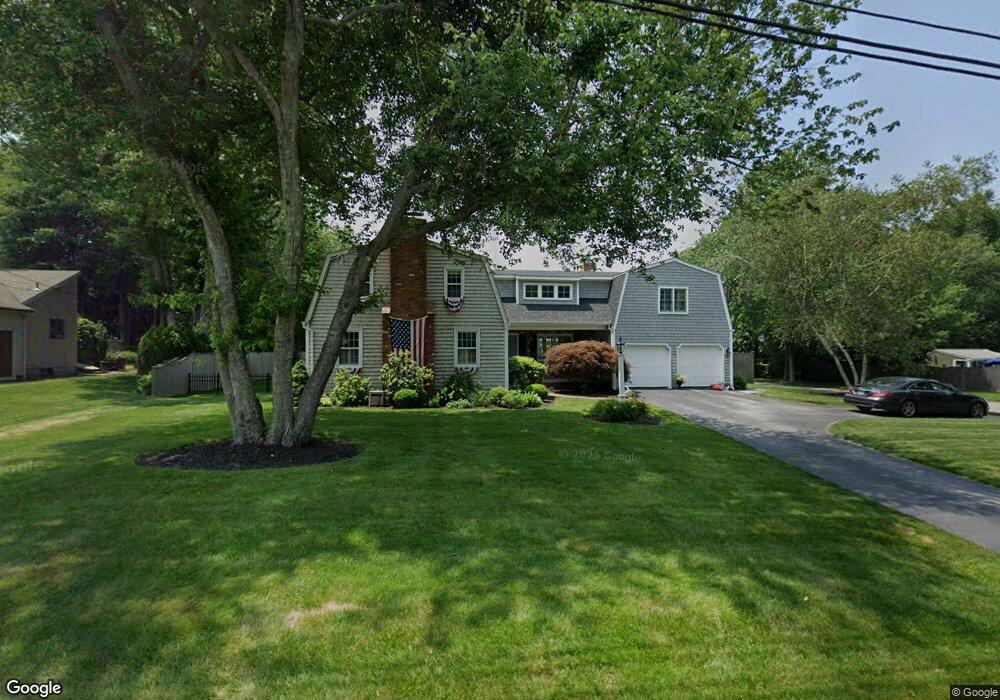
19 Fesser Ave Bristol, RI 02809
Downtown Bristol NeighborhoodEstimated Value: $983,000 - $1,083,000
3
Beds
2
Baths
2,100
Sq Ft
$490/Sq Ft
Est. Value
About This Home
This home is located at 19 Fesser Ave, Bristol, RI 02809 and is currently estimated at $1,029,293, approximately $490 per square foot. 19 Fesser Ave is a home located in Bristol County with nearby schools including Mt. Hope High School and Our Lady of Mt. Carmel School.
Ownership History
Date
Name
Owned For
Owner Type
Purchase Details
Closed on
Jul 11, 2001
Sold by
Mcmanus William F and Mcmanus Mary E
Bought by
Morenzi Joseph and Morenzi Maura
Current Estimated Value
Purchase Details
Closed on
Dec 28, 1994
Sold by
Pardales Paul C and Pardales Mellissa
Bought by
Mcmanus William F and Mcmanus Maryelizabeth
Purchase Details
Closed on
Nov 26, 1991
Sold by
Cassels Peter A
Bought by
Pardales Paul C
Create a Home Valuation Report for This Property
The Home Valuation Report is an in-depth analysis detailing your home's value as well as a comparison with similar homes in the area
Home Values in the Area
Average Home Value in this Area
Purchase History
| Date | Buyer | Sale Price | Title Company |
|---|---|---|---|
| Morenzi Joseph | $306,000 | -- | |
| Mcmanus William F | $193,000 | -- | |
| Pardales Paul C | $183,000 | -- |
Source: Public Records
Mortgage History
| Date | Status | Borrower | Loan Amount |
|---|---|---|---|
| Open | Pardales Paul C | $367,000 | |
| Closed | Pardales Paul C | $366,300 |
Source: Public Records
Tax History Compared to Growth
Tax History
| Year | Tax Paid | Tax Assessment Tax Assessment Total Assessment is a certain percentage of the fair market value that is determined by local assessors to be the total taxable value of land and additions on the property. | Land | Improvement |
|---|---|---|---|---|
| 2025 | $7,779 | $562,900 | $185,700 | $377,200 |
| 2024 | $7,779 | $562,900 | $185,700 | $377,200 |
| 2023 | $7,520 | $562,900 | $185,700 | $377,200 |
| 2022 | $7,318 | $562,900 | $185,700 | $377,200 |
| 2021 | $7,331 | $509,800 | $196,300 | $313,500 |
| 2020 | $7,173 | $509,800 | $196,300 | $313,500 |
| 2019 | $6,225 | $453,700 | $196,300 | $257,400 |
| 2018 | $5,854 | $380,600 | $155,100 | $225,500 |
| 2017 | $4,928 | $330,300 | $132,200 | $198,100 |
| 2016 | $4,879 | $330,300 | $132,200 | $198,100 |
| 2015 | $4,634 | $330,300 | $132,200 | $198,100 |
| 2014 | $5,234 | $400,770 | $166,400 | $234,370 |
Source: Public Records
Map
Nearby Homes
- 60 Van Wickle Ln
- 38 Collins St
- 50 Charles St
- 82 Charles St
- 48 Constitution St Unit 2
- 48 Constitution St Unit 1
- 53 Catherine St
- 18 State St Unit 5 (3rd Floor East)
- 291 High St
- 22 Magnolia St
- 341 Thames St Unit 109
- 44 Bradford St Unit 48
- 44 Bradford St Unit 49
- 44 Bradford St Unit 52
- 21 Bradford St Unit 2
- 214 Franklin St
- 2 Chilton St
- 2 Wilson St
- 107 Franklin St
- 70 Magnolia St