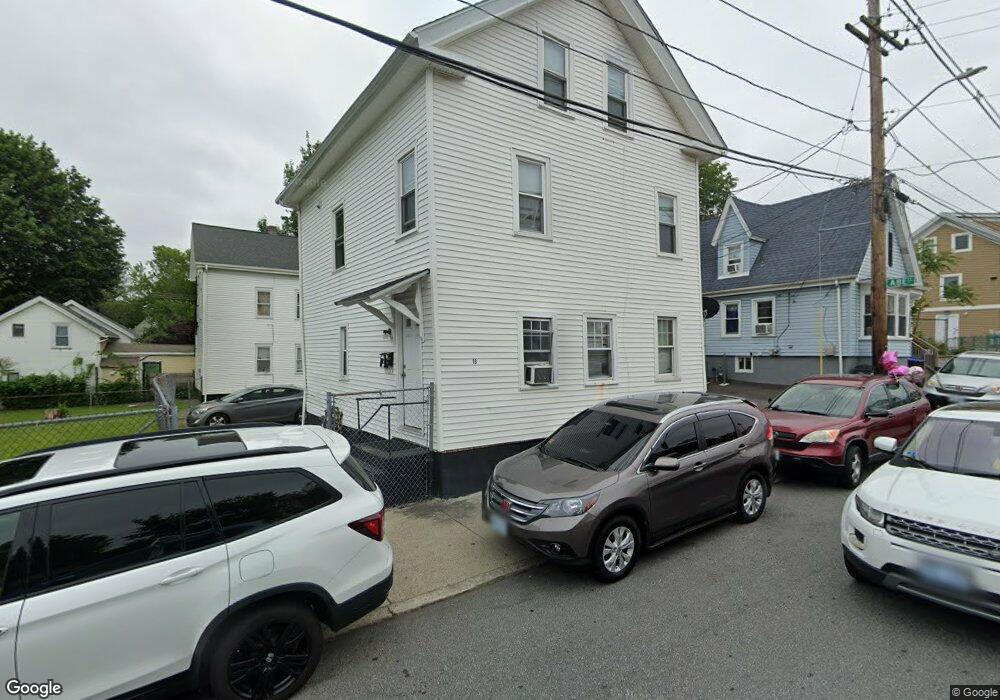
19 Fillmore St Providence, RI 02908
Smith Hill NeighborhoodEstimated Value: $422,822 - $497,000
5
Beds
2
Baths
1,426
Sq Ft
$315/Sq Ft
Est. Value
About This Home
This home is located at 19 Fillmore St, Providence, RI 02908 and is currently estimated at $448,706, approximately $314 per square foot. 19 Fillmore St is a home located in Providence County with nearby schools including Asa Messer Elementary School, Charles N. Fortes Elementary School, and Veazie Street Elementary School.
Ownership History
Date
Name
Owned For
Owner Type
Purchase Details
Closed on
Jan 20, 2015
Sold by
Peter Dipaola Ret and Dipaola
Bought by
Raheb Samuel M
Current Estimated Value
Home Financials for this Owner
Home Financials are based on the most recent Mortgage that was taken out on this home.
Original Mortgage
$48,750
Outstanding Balance
$16,476
Interest Rate
3.1%
Mortgage Type
New Conventional
Estimated Equity
$432,230
Purchase Details
Closed on
Sep 19, 2011
Sold by
Dipaola Peter
Bought by
Peter Dipaola Ret and Dipaola
Purchase Details
Closed on
Jan 21, 2010
Sold by
Fhlmc
Bought by
Dipaola Peter
Purchase Details
Closed on
Aug 27, 2009
Sold by
Mcinerney Ronald W and Mcinerney Karen L
Bought by
Fhlmc
Purchase Details
Closed on
May 2, 2005
Sold by
Johnson Harry O
Bought by
Mcinerney Ronald W and Mcinerney Karen L
Purchase Details
Closed on
Sep 22, 2000
Sold by
Good Investments
Bought by
Johnson Harry O
Purchase Details
Closed on
Mar 14, 2000
Sold by
Bankers Trust Co Calif
Bought by
Miele Frank S
Create a Home Valuation Report for This Property
The Home Valuation Report is an in-depth analysis detailing your home's value as well as a comparison with similar homes in the area
Home Values in the Area
Average Home Value in this Area
Purchase History
| Date | Buyer | Sale Price | Title Company |
|---|---|---|---|
| Raheb Samuel M | $65,000 | -- | |
| Peter Dipaola Ret | -- | -- | |
| Dipaola Peter | -- | -- | |
| Fhlmc | $94,176 | -- | |
| Mcinerney Ronald W | $145,000 | -- | |
| Johnson Harry O | $63,000 | -- | |
| Miele Frank S | $25,000 | -- |
Source: Public Records
Mortgage History
| Date | Status | Borrower | Loan Amount |
|---|---|---|---|
| Open | Raheb Samuel M | $48,750 | |
| Closed | Miele Frank S | $48,750 | |
| Previous Owner | Miele Frank S | $177,000 |
Source: Public Records
Tax History Compared to Growth
Tax History
| Year | Tax Paid | Tax Assessment Tax Assessment Total Assessment is a certain percentage of the fair market value that is determined by local assessors to be the total taxable value of land and additions on the property. | Land | Improvement |
|---|---|---|---|---|
| 2024 | $3,863 | $210,500 | $70,500 | $140,000 |
| 2023 | $3,863 | $210,500 | $70,500 | $140,000 |
| 2022 | $3,747 | $210,500 | $70,500 | $140,000 |
| 2021 | $2,957 | $120,400 | $38,800 | $81,600 |
| 2020 | $2,957 | $120,400 | $38,800 | $81,600 |
| 2019 | $2,957 | $120,400 | $38,800 | $81,600 |
| 2018 | $2,985 | $93,400 | $37,900 | $55,500 |
| 2017 | $2,985 | $93,400 | $37,900 | $55,500 |
| 2016 | $2,985 | $93,400 | $37,900 | $55,500 |
| 2015 | $2,959 | $89,400 | $43,400 | $46,000 |
| 2014 | $3,017 | $89,400 | $43,400 | $46,000 |
| 2013 | $3,017 | $89,400 | $43,400 | $46,000 |
Source: Public Records
Map
Nearby Homes
- 21 Fillmore St
- 0 0 Ave
- 0 Francis Sub Lot 2 Ave Unit 1006087
- 0 Francis Sub Lot 2 Ave Unit 1018440
- 0 0 Ave
- 0 0 Ave
- 4 Abe Ct
- 11 Fillmore St
- 0 Francis Sub Lot 3 Ave Unit 1006088
- 0 Francis Sub Lot 3 Ave Unit 1018444
- 27 Fillmore St
- 20 Whipple St
- 9 Book Ct
- 12 Whipple St
- 33 Fillmore St
- 187 Douglas Ave
- 187 Douglas Ave Unit 1
- 24 Whipple St
- 169 Douglas Ave
- 39 Fillmore St