NOT LISTED FOR SALE

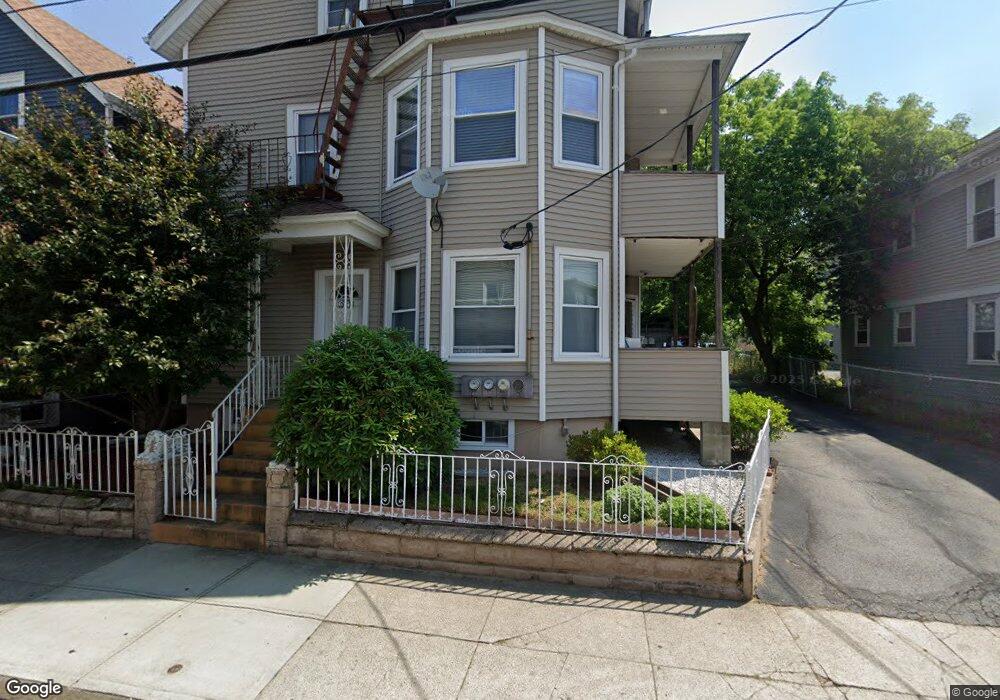
19 Fletcher St Central Falls, RI 02863

Estimated Value: $386,673 - $558,000

8 Beds
4 Baths
2,823 Sq Ft
$170/Sq Ft Est. Value

About This Home

This home is located at 19 Fletcher St, Central Falls, RI 02863 and is currently estimated at $478,668, approximately $169 per square foot. 19 Fletcher St is a home located in Providence County with nearby schools including Central Falls Senior High School, Blackstone Valley Prep Elementary School 2, and Blackstone Valley Prep Junior High School.

Ownership History

Date Name Owned For Owner Type

Purchase Details

Closed on
Feb 14, 2011
Sold by
Noriega Bernardino M
Bought by
Noriega Bernardino M and Morales Edna H
Current Estimated Value
$478,668

Purchase Details

Closed on
Dec 23, 2004
Sold by
Laflamme Ronald P and Laflamme Iluminada
Bought by
Morales-Noriega B and Morales Edna

Home Financials for this Owner

Home Financials are based on the most recent Mortgage that was taken out on this home.
Original Mortgage
$10,650
Interest Rate
5.74%
Mortgage Type
Purchase Money Mortgage

Purchase Details

Closed on
Jan 31, 1989
Sold by
Deleon Hector
Bought by
Plante Donald G
Source: Public Records

Range of Values:

Collateral Analytics

Collateral Analytics Collateral Analytics AVMs (Automated Valuation Model) employ a number of statistical approaches combined with neighborhood-specific comparable selection guarantees the most up-to-date and precise valuations.

Not Available

Collateral Analytics does not have data for the current month. Please view the chart for historical values.

ICE

ICE Mortgage Technology ICE Mortgage Technology’s AVM (Automated Valuation Model) is a state-of-the-art online residential property valuation tool that provides a quick and accurate estimate of the value of almost any home in the U.S.

Not Available

ICE Mortgage Technology does not have data for the current month. Please view the chart for historical values.

First American

First American First American Data & Analytics’ next-generation AVM combines unrivaled data assets with a blended ensemble of valuation models to produce highly accurate, reliable valuations you can trust.

Not Available

First American does not have data for the current month. Please view the chart for historical values.

Quantarium

Quantarium Quantarium’s valuation service, repeatedly proven the industry’s most accurate and comprehensive, is supercharged with a self-learning and auto-tuning AI engine that continually becomes smarter and more accurate as it processes daily inputs from the industry’s leading RE data lake.

Not Available

Quantarium does not have data for the current month. Please view the chart for historical values.

Average Value
Not Available
List Price
Sold Price
Create a Home Valuation Report for This Property
The Home Valuation Report is an in-depth analysis detailing your home's value as well as a comparison with similar homes in the area

Home Values in the Area

Source: Public Records

Average Home Value in this Area


Source: Public Records

Purchase History

Date Buyer Sale Price Title Company
Noriega Bernardino M -- --
Morales-Noriega B $213,000 --
Morales Morales-Noriega B $213,000 --
Plante Donald G $135,000 --
Source: Public Records

Mortgage History

Date Status Borrower Loan Amount
Open Morales Morales-Noriega B $175,000
Previous Owner Plante Donald G $12,000
Previous Owner Plante Donald G $182,800
Previous Owner Plante Donald G $10,650
Source: Public Records

Tax History Compared to Growth

Source: Public Records

Tax History

Year Tax Paid Tax Assessment Tax Assessment Total Assessment is a certain percentage of the fair market value that is determined by local assessors to be the total taxable value of land and additions on the property. Land Improvement
2024 $5,323 $283,000 $79,500 $203,500
2023 $5,250 $283,000 $79,500 $203,500
2022 $3,396 $283,000 $79,500 $203,500
2021 $4,234 $178,200 $27,500 $150,700
2020 $4,222 $178,200 $27,500 $150,700
2019 $4,412 $178,200 $27,500 $150,700
2018 $3,594 $136,600 $26,500 $110,100
2017 $3,594 $136,600 $26,500 $110,100
2016 $3,542 $136,600 $26,500 $110,100
2015 $3,741 $135,400 $25,000 $110,400
2014 $3,691 $135,400 $25,000 $110,400
2013 $3,482 $135,400 $25,000 $110,400
Source: Public Records

Map