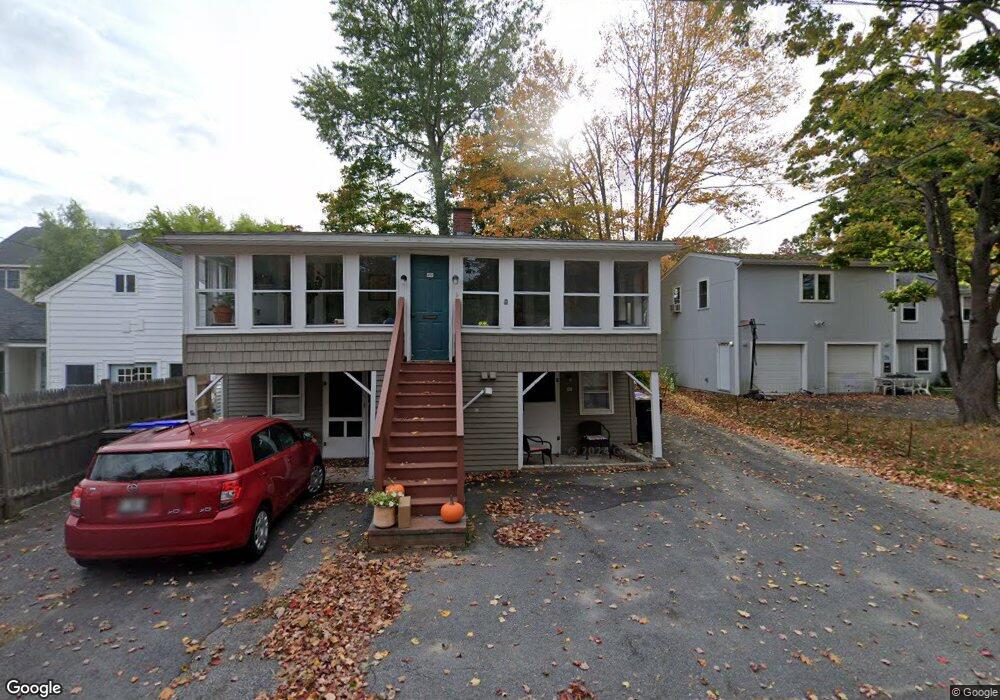
19 Foote St Old Orchard Beach, ME 04064
Estimated Value: $600,000 - $905,000
--
Bed
3
Baths
1,768
Sq Ft
$430/Sq Ft
Est. Value
About This Home
This home is located at 19 Foote St, Old Orchard Beach, ME 04064 and is currently estimated at $760,333, approximately $430 per square foot. 19 Foote St is a home located in York County with nearby schools including Jameson Elementary School, Loranger Memorial School, and Old Orchard Beach High School.
Ownership History
Date
Name
Owned For
Owner Type
Purchase Details
Closed on
Dec 3, 2014
Sold by
Paul R & C C Paquette Ret
Bought by
Paquette Paul R
Current Estimated Value
Home Financials for this Owner
Home Financials are based on the most recent Mortgage that was taken out on this home.
Original Mortgage
$114,000
Outstanding Balance
$39,359
Interest Rate
3.93%
Mortgage Type
Unknown
Estimated Equity
$720,974
Purchase Details
Closed on
Aug 25, 2008
Sold by
Paquette Paul R and Paquette Christine C
Bought by
Paquette Paul R and Paquette Christine C
Purchase Details
Closed on
Jun 16, 2008
Sold by
P R & C Paquette Ret
Bought by
Paquette Paul R and Paquette Christine C
Home Financials for this Owner
Home Financials are based on the most recent Mortgage that was taken out on this home.
Original Mortgage
$203,500
Interest Rate
6.13%
Mortgage Type
Unknown
Purchase Details
Closed on
Jan 8, 2007
Sold by
Paquette Christine C and Paquette Paul R
Bought by
Sylvia W Graham Ret
Create a Home Valuation Report for This Property
The Home Valuation Report is an in-depth analysis detailing your home's value as well as a comparison with similar homes in the area
Home Values in the Area
Average Home Value in this Area
Purchase History
| Date | Buyer | Sale Price | Title Company |
|---|---|---|---|
| Paquette Paul R | -- | -- | |
| Paquette Paul R | -- | -- | |
| Paquette Paul R | -- | -- | |
| Sylvia W Graham Ret | -- | -- |
Source: Public Records
Mortgage History
| Date | Status | Borrower | Loan Amount |
|---|---|---|---|
| Open | Paquette Paul R | $114,000 | |
| Previous Owner | Sylvia W Graham Ret | $203,500 |
Source: Public Records
Tax History Compared to Growth
Tax History
| Year | Tax Paid | Tax Assessment Tax Assessment Total Assessment is a certain percentage of the fair market value that is determined by local assessors to be the total taxable value of land and additions on the property. | Land | Improvement |
|---|---|---|---|---|
| 2024 | $3,855 | $354,300 | $121,600 | $232,700 |
| 2023 | $3,463 | $303,800 | $101,800 | $202,000 |
| 2022 | $3,086 | $252,100 | $77,900 | $174,200 |
| 2021 | $2,747 | $194,000 | $65,900 | $128,100 |
| 2020 | $2,797 | $181,400 | $57,200 | $124,200 |
| 2019 | $2,812 | $181,400 | $57,200 | $124,200 |
| 2018 | $2,678 | $175,000 | $57,200 | $117,800 |
| 2017 | $2,594 | $165,200 | $48,600 | $116,600 |
| 2016 | $2,573 | $166,400 | $49,800 | $116,600 |
| 2015 | $2,526 | $166,400 | $49,800 | $116,600 |
| 2014 | $2,476 | $166,400 | $49,800 | $116,600 |
| 2013 | $2,296 | $166,400 | $49,800 | $116,600 |
Source: Public Records
Map
Nearby Homes
- 5 Carll Ave
- 2 Foote St Unit 1
- 2 Foote St Unit 9
- 2 Wintergreen St
- 21 Milliken St
- 40 E Grand Ave
- 1 Boisvert St Unit 3
- 70 E Grand Ave Unit 111
- 57 E Grand Ave
- 26 Walnut St Unit C2
- 1 E Grand Ave Unit 503
- 78 E Grand Ave Unit 102
- 78 E Grand Ave Unit 103
- 34 School St
- 7 Heath St Unit 22
- 125 Portland Ave Unit 24
- 43 Grove Ave
- 39 W Grand Ave Unit 410
- 39 W Grand Ave Unit 510
- 39 W Grand Ave Unit 23