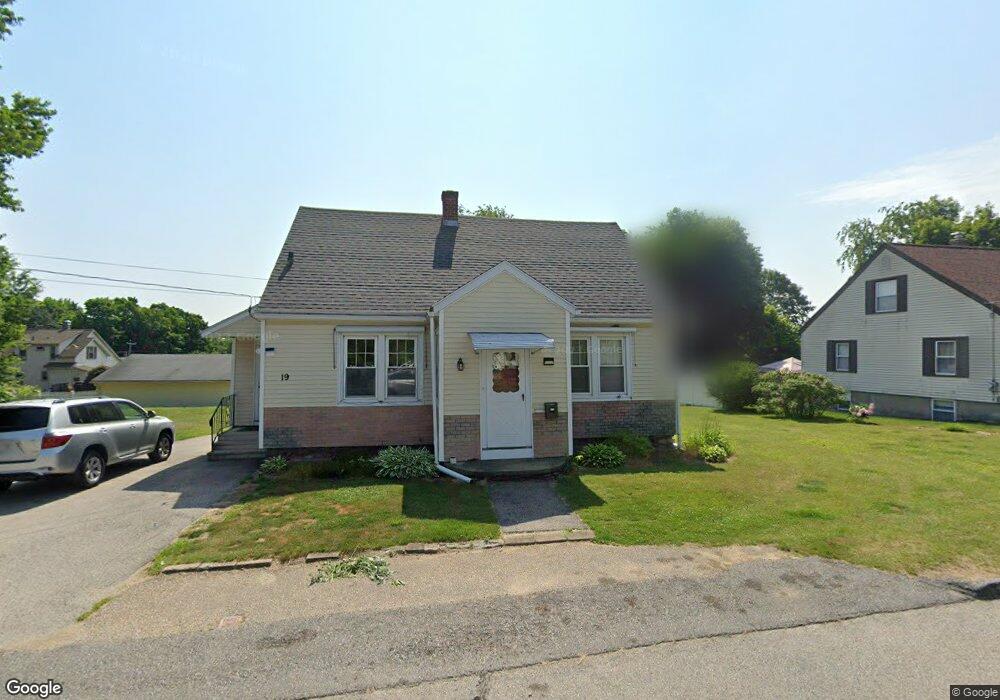
19 Gates Ct Auburn, MA 01501
Stoneville NeighborhoodEstimated Value: $395,000 - $483,000
4
Beds
2
Baths
1,296
Sq Ft
$332/Sq Ft
Est. Value
About This Home
This home is located at 19 Gates Ct, Auburn, MA 01501 and is currently estimated at $430,713, approximately $332 per square foot. 19 Gates Ct is a home located in Worcester County with nearby schools including Auburn Senior High School and Shrewsbury Montessori School - Auburn Campus.
Ownership History
Date
Name
Owned For
Owner Type
Purchase Details
Closed on
Apr 20, 2010
Sold by
Rkc Realty Inc
Bought by
Cusson William R
Current Estimated Value
Purchase Details
Closed on
Feb 13, 2006
Sold by
Keenan Beverly A and Roy Joyce M
Bought by
Cusson William R
Home Financials for this Owner
Home Financials are based on the most recent Mortgage that was taken out on this home.
Original Mortgage
$185,000
Interest Rate
6.27%
Mortgage Type
Purchase Money Mortgage
Create a Home Valuation Report for This Property
The Home Valuation Report is an in-depth analysis detailing your home's value as well as a comparison with similar homes in the area
Home Values in the Area
Average Home Value in this Area
Purchase History
| Date | Buyer | Sale Price | Title Company |
|---|---|---|---|
| Cusson William R | -- | -- | |
| Cusson William R | $100,000 | -- |
Source: Public Records
Mortgage History
| Date | Status | Borrower | Loan Amount |
|---|---|---|---|
| Previous Owner | Cusson William R | $185,000 |
Source: Public Records
Tax History
| Year | Tax Paid | Tax Assessment Tax Assessment Total Assessment is a certain percentage of the fair market value that is determined by local assessors to be the total taxable value of land and additions on the property. | Land | Improvement |
|---|---|---|---|---|
| 2025 | $51 | $356,100 | $124,800 | $231,300 |
| 2024 | $4,821 | $322,900 | $118,400 | $204,500 |
| 2023 | $4,748 | $299,000 | $107,600 | $191,400 |
| 2022 | $4,503 | $267,700 | $107,600 | $160,100 |
| 2021 | $5,115 | $231,800 | $94,900 | $136,900 |
| 2020 | $4,078 | $226,800 | $94,900 | $131,900 |
| 2019 | $4,028 | $218,700 | $93,900 | $124,800 |
| 2018 | $3,808 | $206,500 | $87,800 | $118,700 |
| 2017 | $3,569 | $194,600 | $79,700 | $114,900 |
| 2016 | $3,493 | $193,100 | $83,400 | $109,700 |
| 2015 | $3,314 | $192,000 | $83,400 | $108,600 |
| 2014 | $3,232 | $186,900 | $79,400 | $107,500 |
Source: Public Records
Map
Nearby Homes
- 191 Boyce St
- 176 Boyce St
- 177 Boyce St
- 5 Commonwealth Ave
- 25 Vinal St Unit 26
- 25 Vinal St Unit 29
- 25 Vinal St Unit 30
- 177 Oxford St N
- 19-20 Williams St
- 37 Highland St
- 27 Havana Rd
- 22 Lanark St
- 1-9 Helens Way
- 315 Stafford St
- 83 Bryn Mawr Ave
- 170 Stafford St
- 1 Ashcroft St
- 36 Inwood Rd
- 30 Briarcliff Dr
- 6 Newton St