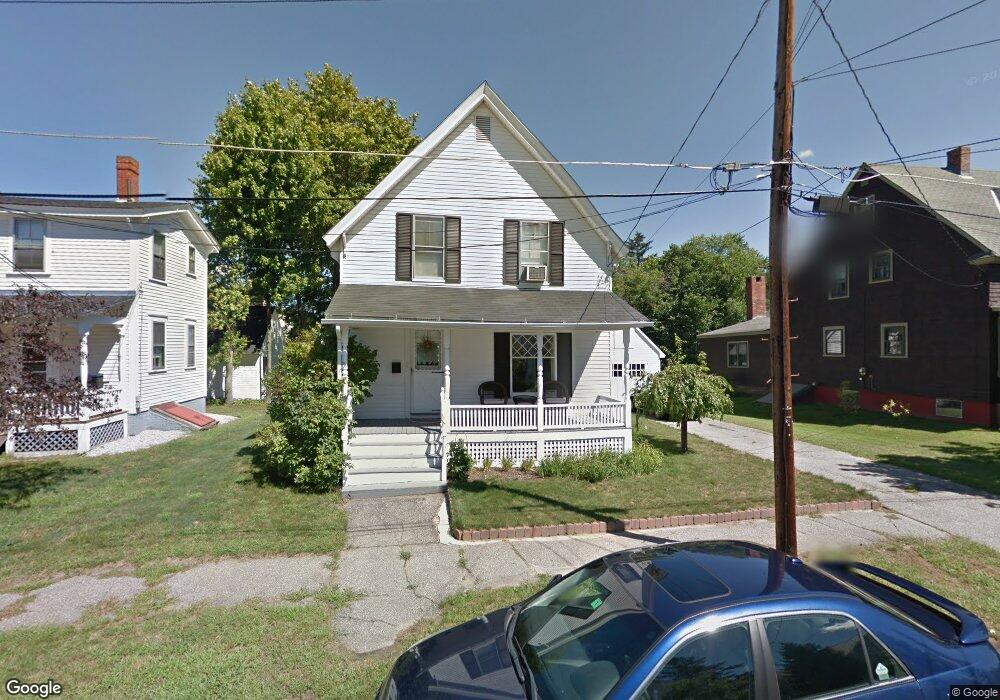
19 Gilmore St Concord, NH 03301
South End NeighborhoodEstimated Value: $409,000 - $422,000
3
Beds
1
Bath
1,171
Sq Ft
$355/Sq Ft
Est. Value
About This Home
This home is located at 19 Gilmore St, Concord, NH 03301 and is currently estimated at $415,158, approximately $354 per square foot. 19 Gilmore St is a home located in Merrimack County with nearby schools including Abbot-Downing School, Rundlett Middle School, and Concord High School.
Ownership History
Date
Name
Owned For
Owner Type
Purchase Details
Closed on
Dec 15, 1997
Sold by
Johnson Richard E and Johnson Helen R
Bought by
Johnson Mark R and Johnson Young Ok
Current Estimated Value
Home Financials for this Owner
Home Financials are based on the most recent Mortgage that was taken out on this home.
Original Mortgage
$93,738
Interest Rate
7.14%
Mortgage Type
Purchase Money Mortgage
Create a Home Valuation Report for This Property
The Home Valuation Report is an in-depth analysis detailing your home's value as well as a comparison with similar homes in the area
Home Values in the Area
Average Home Value in this Area
Purchase History
| Date | Buyer | Sale Price | Title Company |
|---|---|---|---|
| Johnson Mark R | $92,000 | -- |
Source: Public Records
Mortgage History
| Date | Status | Borrower | Loan Amount |
|---|---|---|---|
| Open | Johnson Mark R | $140,000 | |
| Closed | Johnson Mark R | $93,738 |
Source: Public Records
Tax History Compared to Growth
Tax History
| Year | Tax Paid | Tax Assessment Tax Assessment Total Assessment is a certain percentage of the fair market value that is determined by local assessors to be the total taxable value of land and additions on the property. | Land | Improvement |
|---|---|---|---|---|
| 2024 | $7,357 | $265,700 | $120,500 | $145,200 |
| 2023 | $7,137 | $265,700 | $120,500 | $145,200 |
| 2022 | $6,879 | $265,700 | $120,500 | $145,200 |
| 2021 | $6,710 | $267,100 | $120,500 | $146,600 |
| 2020 | $6,393 | $238,900 | $94,900 | $144,000 |
| 2019 | $6,112 | $220,000 | $98,600 | $121,400 |
| 2018 | $5,849 | $212,800 | $98,900 | $113,900 |
| 2017 | $5,784 | $204,800 | $98,900 | $105,900 |
| 2016 | $5,356 | $199,000 | $97,100 | $101,900 |
| 2015 | $5,099 | $196,000 | $105,300 | $90,700 |
| 2014 | $5,105 | $196,000 | $105,300 | $90,700 |
| 2013 | -- | $196,000 | $105,300 | $90,700 |
| 2012 | -- | $217,000 | $122,900 | $94,100 |
Source: Public Records
Map
Nearby Homes
- 32 Carter St
- 122 South St
- 0 South St Unit 4969509
- 105 S Main St
- 33 Spruce St
- 0 Spruce St Unit 88
- 24 Badger St
- 22 Wilson Ave
- 14 Downing St
- 37 Thorndike St
- 75 S State St
- 10 Perley St
- 376 S Main St
- 87 S Main St Unit 2
- 25 Fayette St
- 289 South St
- 54 Pleasant St Unit 8
- 73 Warren St Unit 3
- 2 Kensington Rd
- 1 Kensington Rd