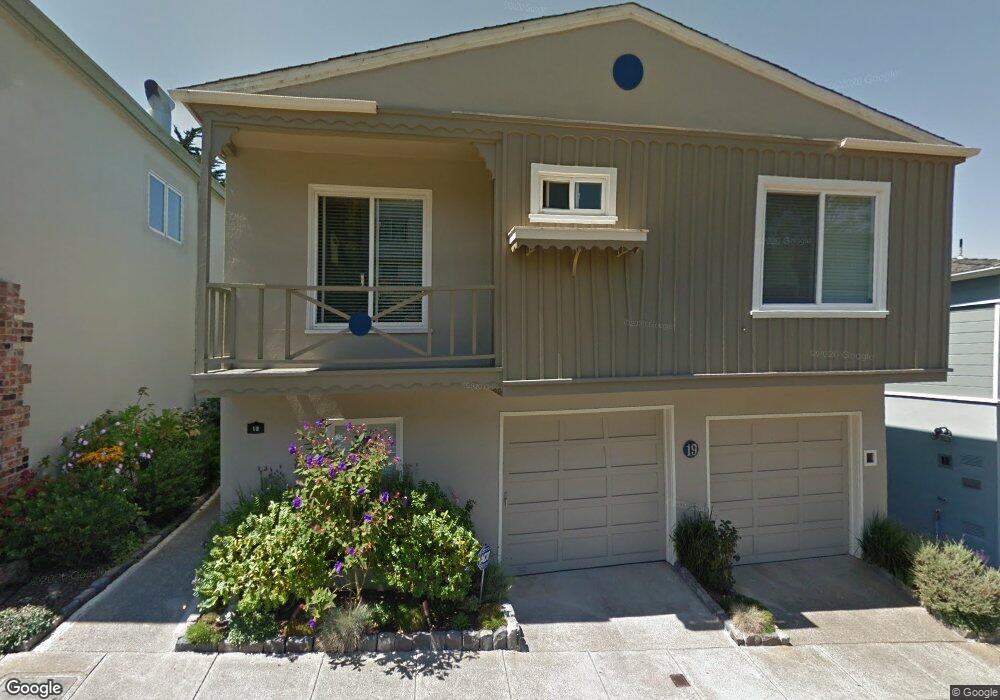
19 Gladeview Way San Francisco, CA 94131
Midtown Terrace NeighborhoodEstimated Value: $1,472,000 - $1,962,000
3
Beds
2
Baths
1,291
Sq Ft
$1,286/Sq Ft
Est. Value
About This Home
This home is located at 19 Gladeview Way, San Francisco, CA 94131 and is currently estimated at $1,659,957, approximately $1,285 per square foot. 19 Gladeview Way is a home located in San Francisco County with nearby schools including Clarendon Alternative Elementary School, Presidio Middle School, and St. Philip School.
Ownership History
Date
Name
Owned For
Owner Type
Purchase Details
Closed on
Jul 8, 2009
Sold by
Goldberg Darlene N Ayala and Ayala Darlene N
Bought by
Goldberg Darlene N Ayala
Current Estimated Value
Purchase Details
Closed on
Mar 4, 2008
Sold by
Goldberg John R
Bought by
Ayala Darlene N
Home Financials for this Owner
Home Financials are based on the most recent Mortgage that was taken out on this home.
Original Mortgage
$417,000
Outstanding Balance
$253,957
Interest Rate
5.41%
Mortgage Type
Purchase Money Mortgage
Estimated Equity
$1,406,000
Purchase Details
Closed on
Jan 25, 2008
Sold by
Miller Lawrence D
Bought by
Ayala Darlene N
Home Financials for this Owner
Home Financials are based on the most recent Mortgage that was taken out on this home.
Original Mortgage
$417,000
Outstanding Balance
$253,957
Interest Rate
5.41%
Mortgage Type
Purchase Money Mortgage
Estimated Equity
$1,406,000
Purchase Details
Closed on
Aug 16, 1996
Sold by
Knottner Edward T and Knottner Priscilla M
Bought by
Knottner Edward T and Knottner Priscilla M
Create a Home Valuation Report for This Property
The Home Valuation Report is an in-depth analysis detailing your home's value as well as a comparison with similar homes in the area
Home Values in the Area
Average Home Value in this Area
Purchase History
| Date | Buyer | Sale Price | Title Company |
|---|---|---|---|
| Goldberg Darlene N Ayala | -- | None Available | |
| Ayala Darlene N | -- | Commonwealth Land Title | |
| Ayala Darlene N | $795,000 | Commonwealth Land Title Co | |
| Knottner Edward T | -- | -- |
Source: Public Records
Mortgage History
| Date | Status | Borrower | Loan Amount |
|---|---|---|---|
| Open | Ayala Darlene N | $417,000 |
Source: Public Records
Tax History Compared to Growth
Tax History
| Year | Tax Paid | Tax Assessment Tax Assessment Total Assessment is a certain percentage of the fair market value that is determined by local assessors to be the total taxable value of land and additions on the property. | Land | Improvement |
|---|---|---|---|---|
| 2025 | $12,585 | $1,093,261 | $730,966 | $362,295 |
| 2024 | $12,585 | $1,071,826 | $716,634 | $355,192 |
| 2023 | $12,404 | $1,050,811 | $702,583 | $348,228 |
| 2022 | $12,182 | $1,030,208 | $688,807 | $341,401 |
| 2021 | $11,971 | $1,010,009 | $675,301 | $334,708 |
| 2020 | $12,008 | $999,654 | $668,377 | $331,277 |
| 2019 | $11,594 | $980,054 | $655,272 | $324,782 |
| 2018 | $11,204 | $960,839 | $642,424 | $318,415 |
| 2017 | $11,072 | $942,001 | $629,828 | $312,173 |
| 2016 | $10,887 | $923,532 | $617,479 | $306,053 |
| 2015 | $10,538 | $868,861 | $608,204 | $260,657 |
| 2014 | $10,259 | $851,843 | $596,291 | $255,552 |
Source: Public Records
Map
Nearby Homes
- 81 Skyview Way
- 105 Skyview Way
- 172 Panorama Dr
- 1230 1240 Twin Peaks Blvd
- 71 Panorama Dr
- 20 Parkridge Dr Unit 12
- 148 Marview Way
- 38 Portola Dr
- 614 Clarendon Ave
- 298 Portola Dr Unit 103
- 618 Clarendon Ave Unit 42B
- 180 Forest Knolls Dr
- 945 Corbett Ave Unit 206
- 49 High St
- 160 Gardenside Dr Unit 101
- 3890 Market St Unit 1
- 150 Glenbrook Ave
- 180 Palo Alto Ave
- 5004 Diamond Heights Blvd Unit 2
- 202 Oak Park Dr
- 15 Gladeview Way
- 9 Gladeview Way
- 27 Gladeview Way
- 31 Gladeview Way
- 5 Gladeview Way
- 49 Skyview Way
- 51 Skyview Way
- 59 Knollview Way
- 53 Skyview Way
- 55 Knollview Way
- 45 Skyview Way
- 35 Gladeview Way
- 51 Knollview Way
- 1 Gladeview Way
- 67 Knollview Way
- 36 Knollview Way
- 55 Skyview Way
- 47 Knollview Way
- 59 Skyview Way