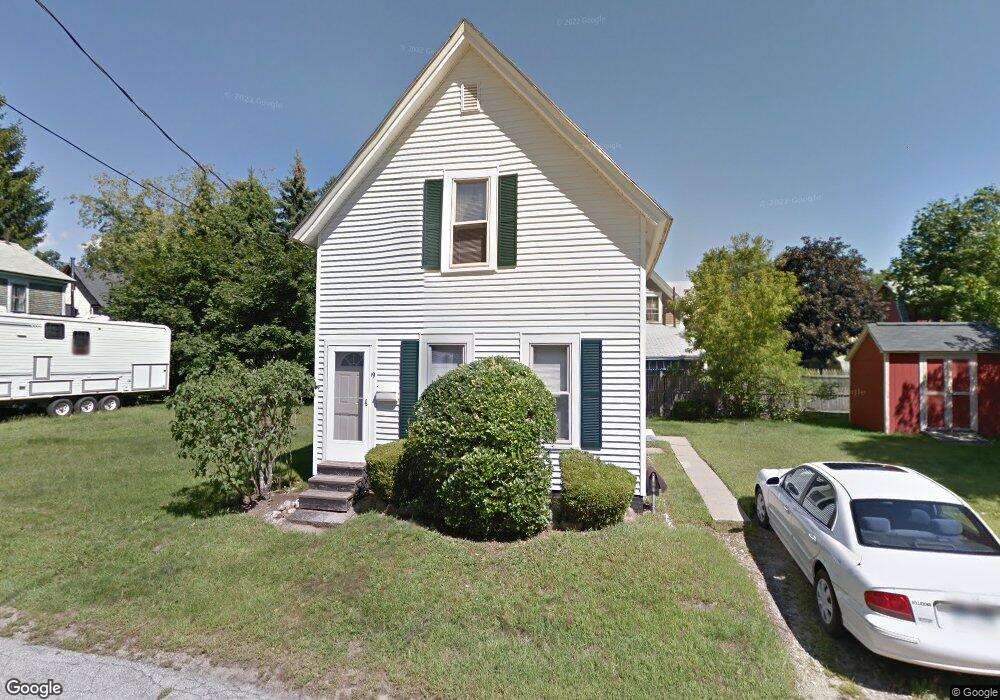
19 Glen St Concord, NH 03301
South End NeighborhoodEstimated Value: $382,670 - $464,000
3
Beds
1
Bath
922
Sq Ft
$447/Sq Ft
Est. Value
About This Home
This home is located at 19 Glen St, Concord, NH 03301 and is currently estimated at $412,168, approximately $447 per square foot. 19 Glen St is a home located in Merrimack County with nearby schools including Abbot-Downing School, Rundlett Middle School, and Concord High School.
Ownership History
Date
Name
Owned For
Owner Type
Purchase Details
Closed on
Sep 29, 1997
Sold by
Torrance David T and Torrance Susan E
Bought by
Cimikoski Richard C
Current Estimated Value
Home Financials for this Owner
Home Financials are based on the most recent Mortgage that was taken out on this home.
Original Mortgage
$71,168
Outstanding Balance
$11,454
Interest Rate
7.47%
Mortgage Type
Purchase Money Mortgage
Estimated Equity
$400,714
Create a Home Valuation Report for This Property
The Home Valuation Report is an in-depth analysis detailing your home's value as well as a comparison with similar homes in the area
Home Values in the Area
Average Home Value in this Area
Purchase History
| Date | Buyer | Sale Price | Title Company |
|---|---|---|---|
| Cimikoski Richard C | $71,300 | -- |
Source: Public Records
Mortgage History
| Date | Status | Borrower | Loan Amount |
|---|---|---|---|
| Open | Cimikoski Richard C | $71,168 |
Source: Public Records
Tax History Compared to Growth
Tax History
| Year | Tax Paid | Tax Assessment Tax Assessment Total Assessment is a certain percentage of the fair market value that is determined by local assessors to be the total taxable value of land and additions on the property. | Land | Improvement |
|---|---|---|---|---|
| 2024 | $5,729 | $206,900 | $101,200 | $105,700 |
| 2023 | $5,557 | $206,900 | $101,200 | $105,700 |
| 2022 | $5,357 | $206,900 | $101,200 | $105,700 |
| 2021 | $5,142 | $204,700 | $101,200 | $103,500 |
| 2020 | $4,881 | $182,400 | $84,500 | $97,900 |
| 2019 | $4,561 | $164,200 | $83,200 | $81,000 |
| 2018 | $4,398 | $156,000 | $79,900 | $76,100 |
| 2017 | $4,228 | $149,700 | $78,500 | $71,200 |
| 2016 | $4,012 | $145,000 | $78,500 | $66,500 |
| 2015 | $3,866 | $136,300 | $71,300 | $65,000 |
| 2014 | $3,654 | $136,300 | $71,300 | $65,000 |
| 2013 | -- | $135,700 | $71,300 | $64,400 |
| 2012 | -- | $141,100 | $71,300 | $69,800 |
Source: Public Records
Map
Nearby Homes
- 0 Spruce St Unit 88
- 33 Spruce St
- 24 Badger St
- 12 Avon St
- 105 S Main St
- 14 Downing St
- 122 South St
- 47 South St
- 14-16 Perley St
- 75 S State St
- 10 Perley St
- 87 S Main St Unit 2
- 0 South St Unit 4969509
- 4 Fayette St
- 54 Pleasant St Unit 8
- 15 Wilson Ave
- 22 Wilson Ave
- 376 S Main St
- 22 Longmeadow Dr
- 41 Longmeadow Dr