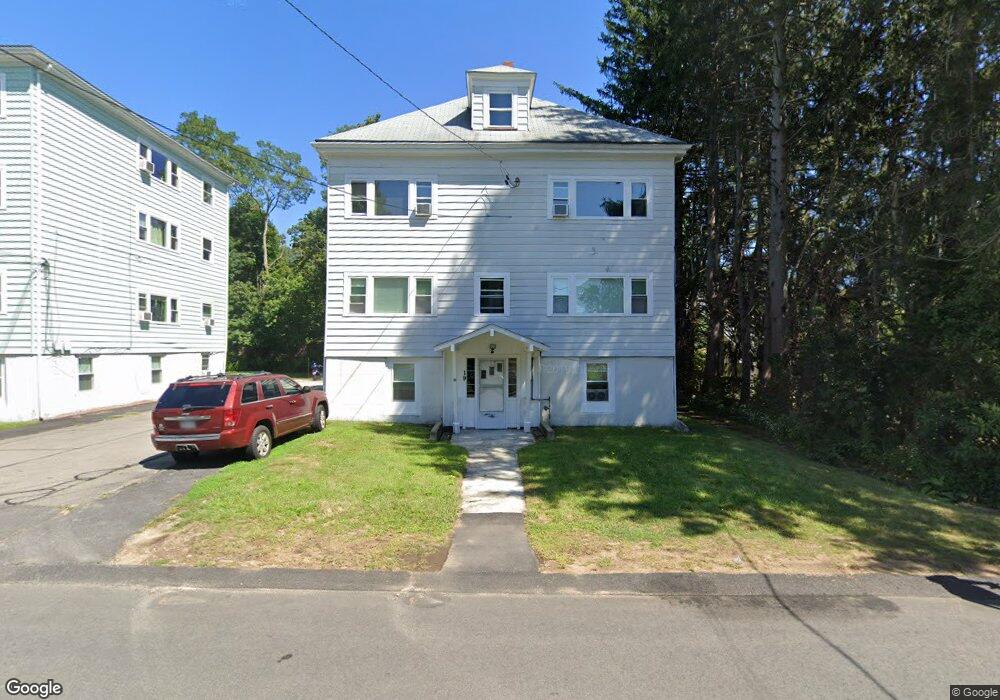
19 Glen St Rockland, MA 02370
Estimated Value: $900,000 - $985,000
20
Beds
10
Baths
9,695
Sq Ft
$97/Sq Ft
Est. Value
About This Home
This home is located at 19 Glen St, Rockland, MA 02370 and is currently estimated at $939,000, approximately $96 per square foot. 19 Glen St is a home located in Plymouth County with nearby schools including Rockland Senior High School, Calvary Chapel Academy, and St Bridget School.
Ownership History
Date
Name
Owned For
Owner Type
Purchase Details
Closed on
Jun 29, 2011
Sold by
Mastrodomenico Andrew
Bought by
Hinghamglen Llc
Current Estimated Value
Home Financials for this Owner
Home Financials are based on the most recent Mortgage that was taken out on this home.
Original Mortgage
$860,000
Outstanding Balance
$656,016
Interest Rate
7%
Mortgage Type
Purchase Money Mortgage
Estimated Equity
$282,984
Purchase Details
Closed on
Oct 8, 2009
Sold by
Famularo Geraldine
Bought by
Famularo Joseph R
Create a Home Valuation Report for This Property
The Home Valuation Report is an in-depth analysis detailing your home's value as well as a comparison with similar homes in the area
Home Values in the Area
Average Home Value in this Area
Purchase History
| Date | Buyer | Sale Price | Title Company |
|---|---|---|---|
| Hinghamglen Llc | $816,400 | -- | |
| Famularo Joseph R | -- | -- |
Source: Public Records
Mortgage History
| Date | Status | Borrower | Loan Amount |
|---|---|---|---|
| Open | Hinghamglen Llc | $860,000 |
Source: Public Records
Tax History Compared to Growth
Tax History
| Year | Tax Paid | Tax Assessment Tax Assessment Total Assessment is a certain percentage of the fair market value that is determined by local assessors to be the total taxable value of land and additions on the property. | Land | Improvement |
|---|---|---|---|---|
| 2025 | $9,092 | $665,100 | $224,300 | $440,800 |
| 2024 | $8,825 | $627,700 | $211,600 | $416,100 |
| 2023 | $8,624 | $566,600 | $184,400 | $382,200 |
| 2022 | $8,263 | $493,300 | $160,400 | $332,900 |
| 2021 | $7,494 | $433,700 | $145,800 | $287,900 |
| 2020 | $7,229 | $413,100 | $138,800 | $274,300 |
| 2019 | $6,575 | $366,900 | $132,300 | $234,600 |
| 2018 | $6,328 | $347,300 | $132,300 | $215,000 |
| 2017 | $5,932 | $321,000 | $125,300 | $195,700 |
| 2016 | $5,712 | $308,900 | $120,500 | $188,400 |
| 2015 | $4,971 | $261,200 | $112,600 | $148,600 |
| 2014 | $4,746 | $258,800 | $110,400 | $148,400 |
Source: Public Records
Map
Nearby Homes
- 63 Webster St
- 45-47 Park St
- 21 Archer Rd
- 17-23 Dyer St Unit 17
- 13 Dyer St Unit 13
- 11 Dyer St Unit 11
- 14 Dyer St Unit 14
- 12 Dyer St Unit 12
- 354 Webster St
- 83 Summit St
- 122 Reed St
- 1 Canterbury Ln
- 6 Chestnut Cir
- 4 Phillips St
- 737-739 Union St
- 94-96 Crescent St
- 5 Juniper Cir
- 23 Payson Ave
- 775 Union St
- 206-208 Hingham St