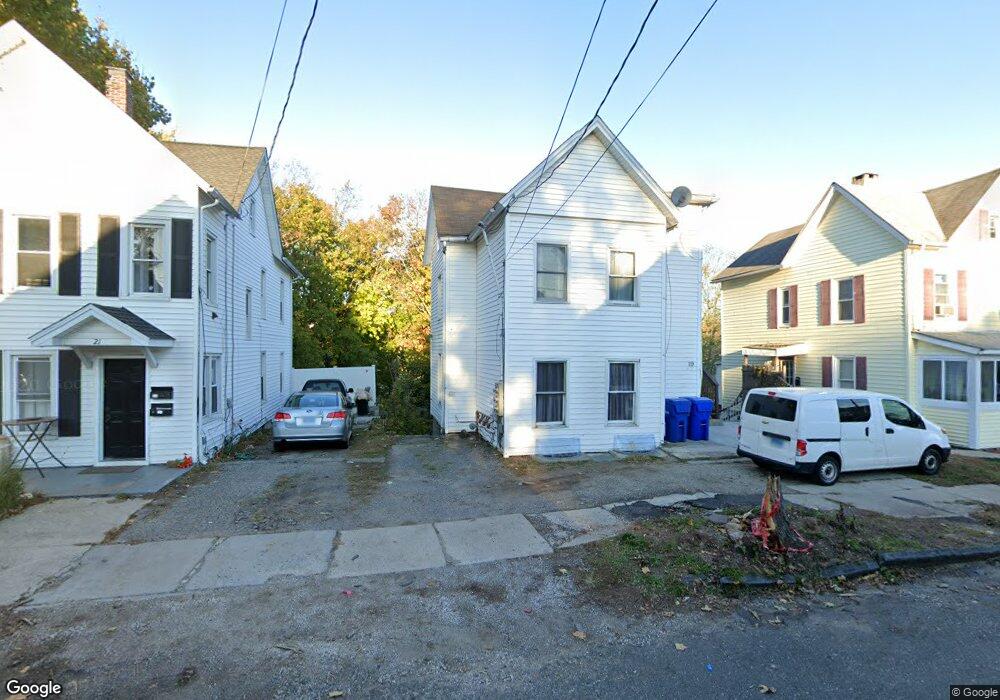
19 Griffing Ave Danbury, CT 06810
Estimated Value: $578,000 - $787,000
5
Beds
3
Baths
1,975
Sq Ft
$333/Sq Ft
Est. Value
About This Home
This home is located at 19 Griffing Ave, Danbury, CT 06810 and is currently estimated at $657,667, approximately $332 per square foot. 19 Griffing Ave is a home located in Fairfield County with nearby schools including Ellsworth Avenue School, Broadview Middle School, and Danbury High School.
Ownership History
Date
Name
Owned For
Owner Type
Purchase Details
Closed on
Nov 2, 2009
Sold by
Us Bank Na
Bought by
Sandoval-Fajardo Carmen M
Current Estimated Value
Home Financials for this Owner
Home Financials are based on the most recent Mortgage that was taken out on this home.
Original Mortgage
$127,645
Outstanding Balance
$83,602
Interest Rate
5.06%
Estimated Equity
$574,065
Purchase Details
Closed on
Mar 10, 2009
Sold by
Chauca Gloria M and Us Bank Na
Bought by
Us Bank Na
Purchase Details
Closed on
Aug 17, 2006
Sold by
Louzada Marco Salem
Bought by
Chauca Jose M and Chauca Gloria M
Home Financials for this Owner
Home Financials are based on the most recent Mortgage that was taken out on this home.
Original Mortgage
$312,000
Interest Rate
6.88%
Purchase Details
Closed on
Nov 21, 2003
Sold by
Loyzado Marguison
Bought by
Loyzado Mancosalen
Purchase Details
Closed on
Jul 16, 2002
Sold by
Goodman Grannia W
Bought by
Malone William and Malone Alice
Create a Home Valuation Report for This Property
The Home Valuation Report is an in-depth analysis detailing your home's value as well as a comparison with similar homes in the area
Home Values in the Area
Average Home Value in this Area
Purchase History
| Date | Buyer | Sale Price | Title Company |
|---|---|---|---|
| Sandoval-Fajardo Carmen M | $130,000 | -- | |
| Us Bank Na | -- | -- | |
| Chauca Jose M | $390,000 | -- | |
| Loyzado Mancosalen | $290,000 | -- | |
| Malone William | $249,900 | -- |
Source: Public Records
Mortgage History
| Date | Status | Borrower | Loan Amount |
|---|---|---|---|
| Open | Malone William | $127,645 | |
| Previous Owner | Malone William | $312,000 | |
| Previous Owner | Malone William | $78,000 |
Source: Public Records
Tax History
| Year | Tax Paid | Tax Assessment Tax Assessment Total Assessment is a certain percentage of the fair market value that is determined by local assessors to be the total taxable value of land and additions on the property. | Land | Improvement |
|---|---|---|---|---|
| 2025 | $6,849 | $274,050 | $60,130 | $213,920 |
| 2024 | $6,698 | $274,050 | $60,130 | $213,920 |
| 2023 | $6,394 | $274,050 | $60,130 | $213,920 |
| 2022 | $5,675 | $201,100 | $63,200 | $137,900 |
| 2021 | $5,550 | $201,100 | $63,200 | $137,900 |
| 2020 | $5,550 | $201,100 | $63,200 | $137,900 |
| 2019 | $5,550 | $201,100 | $63,200 | $137,900 |
| 2018 | $5,550 | $201,100 | $63,200 | $137,900 |
| 2017 | $4,204 | $145,200 | $60,200 | $85,000 |
| 2016 | $4,164 | $145,200 | $60,200 | $85,000 |
| 2015 | $4,103 | $145,200 | $60,200 | $85,000 |
| 2014 | $4,008 | $145,200 | $60,200 | $85,000 |
Source: Public Records
Map
Nearby Homes
- 63 Brentwood Cir Unit 63
- 1 Brentwood Cir Unit 1
- 424 Center Meadow Ln Unit 424
- 185 Brentwood Cir Unit 185
- 1 Union Ave Unit 11
- 68 Virginia Ave Unit 11
- 5 -7-9 Patch St
- 68 Rowan St
- 63A Main St
- 9 Farview Ave Unit 3-12
- 23 Franklin St Unit 1
- 19 Mcdermott St
- 38 Padanaram Ave Unit 1
- 31-33 Wildman St
- 8 Ann Dr Unit B
- 37 Taylor St
- 35 Taylor St
- 15-17 Boughton St Unit 1-6
- 51 Wildman St Unit 305
- 16 Springside Ave
- 21 Griffing Ave
- 23 Griffing Ave
- 23 Griffing Ave Unit Second Floor
- 15 Griffing Ave
- 13 Griffing Ave
- 18 Griffing Ave
- 11 Griffing Ave
- 25 Griffing Ave Unit 27
- 20 Griffing Ave
- 4 Elwell Place
- 14 Griffing Ave
- 22 Griffing Ave
- 12 Griffing Ave
- 24 Griffing Ave Unit 26
- 26 Griffing Ave Unit 2
- 9 Griffing Ave
- 10 Griffing Ave Unit 3
- 10 Griffing Ave Unit 2
- 10 Griffing Ave Unit 1
Your Personal Tour Guide
Ask me questions while you tour the home.