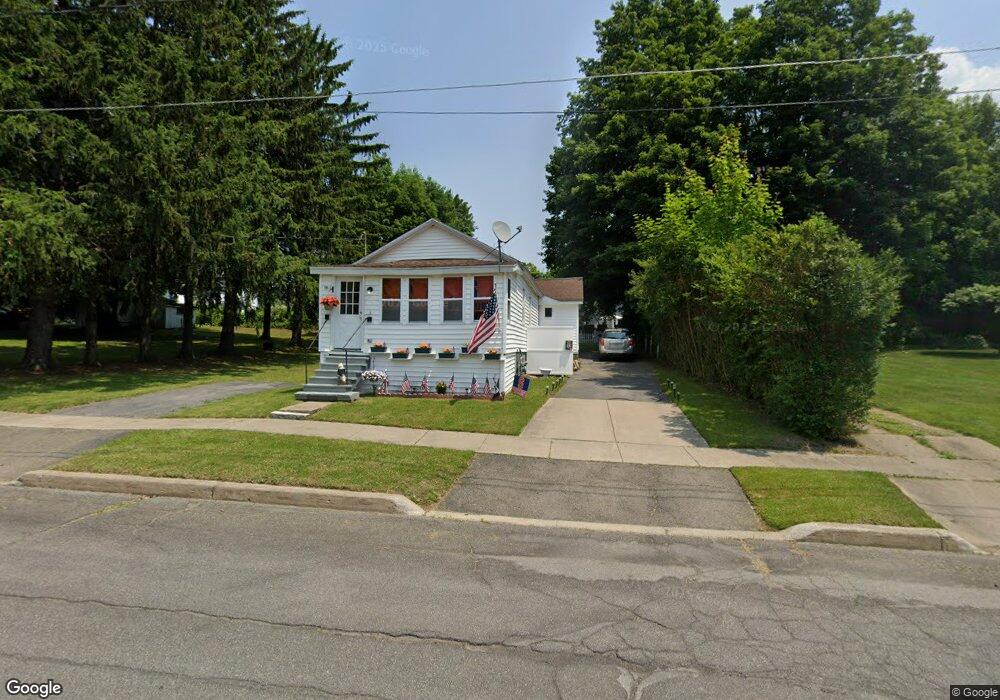
19 Herrick St Oswego, NY 13126
Estimated Value: $92,000 - $116,000
2
Beds
1
Bath
1,149
Sq Ft
$93/Sq Ft
Est. Value
About This Home
This home is located at 19 Herrick St, Oswego, NY 13126 and is currently estimated at $106,693, approximately $92 per square foot. 19 Herrick St is a home located in Oswego County with nearby schools including Leighton Elementary School, Oswego Middle School, and Oswego High School.
Ownership History
Date
Name
Owned For
Owner Type
Purchase Details
Closed on
Oct 25, 2021
Sold by
Cummings Patricia A
Bought by
Madden Sean P
Current Estimated Value
Home Financials for this Owner
Home Financials are based on the most recent Mortgage that was taken out on this home.
Original Mortgage
$36,000
Outstanding Balance
$32,988
Interest Rate
2.99%
Mortgage Type
New Conventional
Estimated Equity
$73,705
Purchase Details
Closed on
Nov 6, 2002
Sold by
Battista Carmella
Bought by
Battista Carmella
Create a Home Valuation Report for This Property
The Home Valuation Report is an in-depth analysis detailing your home's value as well as a comparison with similar homes in the area
Home Values in the Area
Average Home Value in this Area
Purchase History
| Date | Buyer | Sale Price | Title Company |
|---|---|---|---|
| Madden Sean P | $48,000 | Vanguard Research & Ttl Svcs | |
| Battista Carmella | -- | -- |
Source: Public Records
Mortgage History
| Date | Status | Borrower | Loan Amount |
|---|---|---|---|
| Open | Madden Sean P | $36,000 |
Source: Public Records
Tax History Compared to Growth
Tax History
| Year | Tax Paid | Tax Assessment Tax Assessment Total Assessment is a certain percentage of the fair market value that is determined by local assessors to be the total taxable value of land and additions on the property. | Land | Improvement |
|---|---|---|---|---|
| 2024 | $1,506 | $90,000 | $21,100 | $68,900 |
| 2023 | $1,380 | $53,000 | $14,000 | $39,000 |
| 2022 | $1,399 | $53,000 | $14,000 | $39,000 |
| 2021 | $1,423 | $53,000 | $14,000 | $39,000 |
| 2020 | $935 | $49,300 | $14,000 | $35,300 |
| 2019 | $754 | $49,300 | $14,000 | $35,300 |
| 2018 | $1,534 | $49,300 | $14,000 | $35,300 |
| 2017 | $2,288 | $49,300 | $14,000 | $35,300 |
| 2016 | $474 | $49,300 | $14,000 | $35,300 |
| 2015 | -- | $49,300 | $14,000 | $35,300 |
| 2014 | -- | $49,300 | $14,000 | $35,300 |
Source: Public Records
Map
Nearby Homes