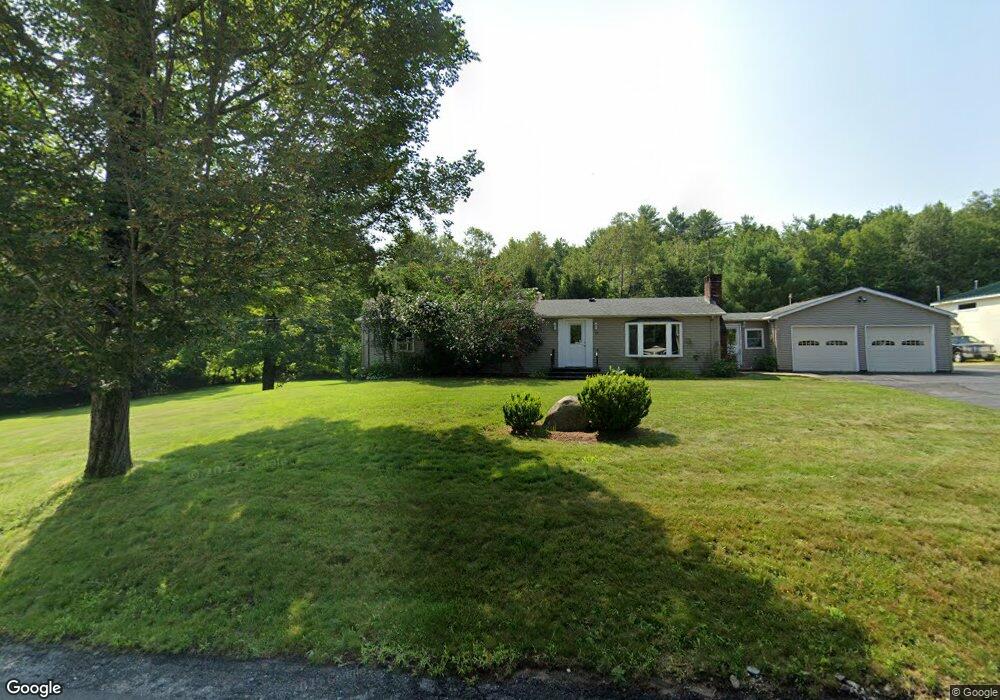
19 Holt Rd Sutton, MA 01590
Estimated Value: $481,772 - $563,000
3
Beds
2
Baths
1,196
Sq Ft
$430/Sq Ft
Est. Value
About This Home
This home is located at 19 Holt Rd, Sutton, MA 01590 and is currently estimated at $513,693, approximately $429 per square foot. 19 Holt Rd is a home located in Worcester County with nearby schools including Sutton Elementary School, Sutton Middle School, and Sutton High School.
Ownership History
Date
Name
Owned For
Owner Type
Purchase Details
Closed on
Sep 16, 1997
Sold by
Briggs Clifford W and Briggs Elizabeth A
Bought by
19 Holt Road Rt and Proctor Charles F
Current Estimated Value
Home Financials for this Owner
Home Financials are based on the most recent Mortgage that was taken out on this home.
Original Mortgage
$112,500
Interest Rate
7.31%
Mortgage Type
Purchase Money Mortgage
Create a Home Valuation Report for This Property
The Home Valuation Report is an in-depth analysis detailing your home's value as well as a comparison with similar homes in the area
Home Values in the Area
Average Home Value in this Area
Purchase History
| Date | Buyer | Sale Price | Title Company |
|---|---|---|---|
| 19 Holt Road Rt | $150,000 | -- |
Source: Public Records
Mortgage History
| Date | Status | Borrower | Loan Amount |
|---|---|---|---|
| Open | 19 Holt Road Rt | $110,000 | |
| Closed | 19 Holt Road Rt | $112,500 | |
| Previous Owner | 19 Holt Road Rt | $15,000 | |
| Previous Owner | 19 Holt Road Rt | $15,000 |
Source: Public Records
Tax History
| Year | Tax Paid | Tax Assessment Tax Assessment Total Assessment is a certain percentage of the fair market value that is determined by local assessors to be the total taxable value of land and additions on the property. | Land | Improvement |
|---|---|---|---|---|
| 2025 | $5,302 | $441,100 | $178,800 | $262,300 |
| 2024 | $5,608 | $442,300 | $171,300 | $271,000 |
| 2023 | $4,992 | $360,400 | $155,300 | $205,100 |
| 2022 | $5,100 | $336,000 | $124,100 | $211,900 |
| 2021 | $0 | $294,600 | $124,100 | $170,500 |
| 2020 | $6,482 | $294,600 | $124,100 | $170,500 |
| 2019 | $4,503 | $272,600 | $124,100 | $148,500 |
| 2018 | $5,248 | $245,100 | $105,500 | $139,600 |
| 2017 | $3,891 | $235,800 | $92,600 | $143,200 |
| 2016 | $3,845 | $230,500 | $92,600 | $137,900 |
| 2015 | $3,835 | $229,900 | $92,600 | $137,300 |
| 2014 | $3,698 | $219,100 | $91,700 | $127,400 |
Source: Public Records
Map
Nearby Homes
- 19 Birch St
- 18 Lakeshore Dr
- 4 1st St
- 108 Mumford St
- 266 Putnam Hill Rd
- 24 Manchaug Rd
- 60 Webster St
- Lot 27 Cedar St
- 109 Mendon Rd
- 7 Tower Hill Rd
- 36 Compass Point Dr Unit 36
- 26 Compass Point Dr Unit 26
- 33 Nautical Way Unit 107
- 3 S East Main St
- 22 Gilboa St
- 8 Hough Rd
- 5 B St
- 5 Hamlets Way
- 198 Uxbridge Rd
- 408 NE Main St
Your Personal Tour Guide
Ask me questions while you tour the home.