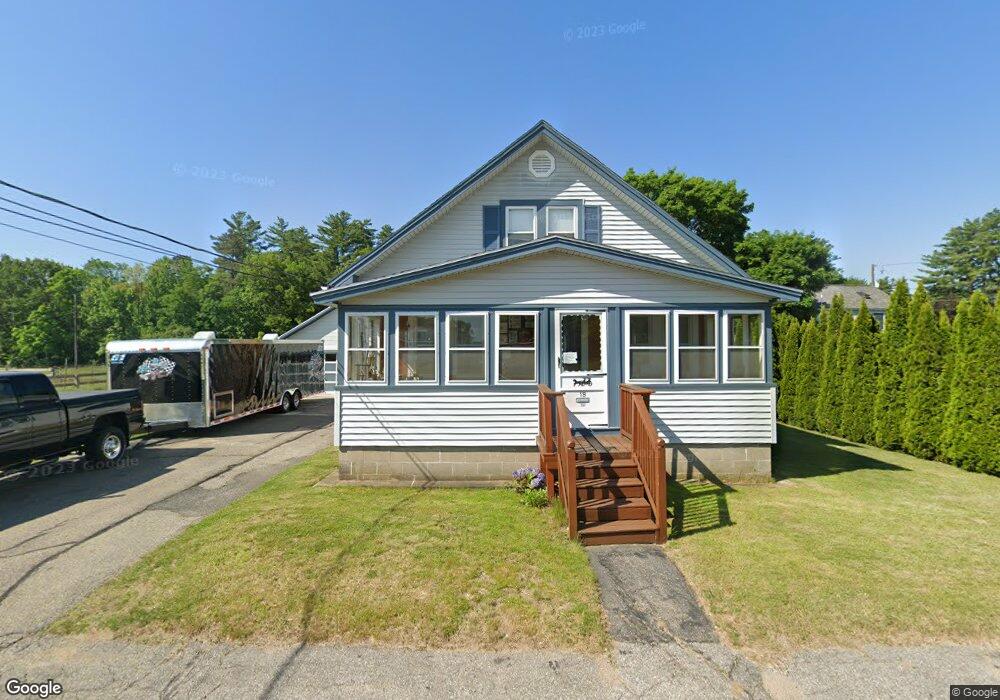
19 Hoover St Rochester, NH 03867
Estimated Value: $306,000 - $357,000
3
Beds
1
Bath
1,092
Sq Ft
$311/Sq Ft
Est. Value
About This Home
This home is located at 19 Hoover St, Rochester, NH 03867 and is currently estimated at $339,279, approximately $310 per square foot. 19 Hoover St is a home located in Strafford County with nearby schools including Mcclelland School, Rochester Middle School, and Spaulding High School.
Ownership History
Date
Name
Owned For
Owner Type
Purchase Details
Closed on
Jun 4, 1996
Sold by
Concord Svgs Bk
Bought by
Spurling Michael
Current Estimated Value
Home Financials for this Owner
Home Financials are based on the most recent Mortgage that was taken out on this home.
Original Mortgage
$42,500
Outstanding Balance
$2,693
Interest Rate
7.91%
Mortgage Type
Purchase Money Mortgage
Estimated Equity
$336,586
Purchase Details
Closed on
Feb 28, 1996
Sold by
Lajoie Allan G and Lajoie Jeanne D
Bought by
Concord Svgs Bk
Create a Home Valuation Report for This Property
The Home Valuation Report is an in-depth analysis detailing your home's value as well as a comparison with similar homes in the area
Home Values in the Area
Average Home Value in this Area
Purchase History
| Date | Buyer | Sale Price | Title Company |
|---|---|---|---|
| Spurling Michael | $53,000 | -- | |
| Concord Svgs Bk | $55,000 | -- |
Source: Public Records
Mortgage History
| Date | Status | Borrower | Loan Amount |
|---|---|---|---|
| Open | Concord Svgs Bk | $42,500 |
Source: Public Records
Tax History Compared to Growth
Tax History
| Year | Tax Paid | Tax Assessment Tax Assessment Total Assessment is a certain percentage of the fair market value that is determined by local assessors to be the total taxable value of land and additions on the property. | Land | Improvement |
|---|---|---|---|---|
| 2024 | $4,470 | $301,000 | $78,900 | $222,100 |
| 2023 | $4,489 | $174,400 | $46,000 | $128,400 |
| 2022 | $4,409 | $174,400 | $46,000 | $128,400 |
| 2021 | $4,299 | $174,400 | $46,000 | $128,400 |
| 2020 | $4,297 | $174,600 | $46,000 | $128,600 |
| 2019 | $4,360 | $175,100 | $46,500 | $128,600 |
| 2018 | $3,990 | $145,000 | $31,800 | $113,200 |
| 2017 | $3,818 | $145,000 | $31,800 | $113,200 |
| 2016 | $3,592 | $127,100 | $31,800 | $95,300 |
| 2015 | $3,550 | $126,100 | $31,800 | $94,300 |
| 2014 | $3,464 | $126,100 | $31,800 | $94,300 |
| 2013 | $3,456 | $131,100 | $43,700 | $87,400 |
| 2012 | $3,367 | $131,100 | $43,700 | $87,400 |
Source: Public Records
Map
Nearby Homes