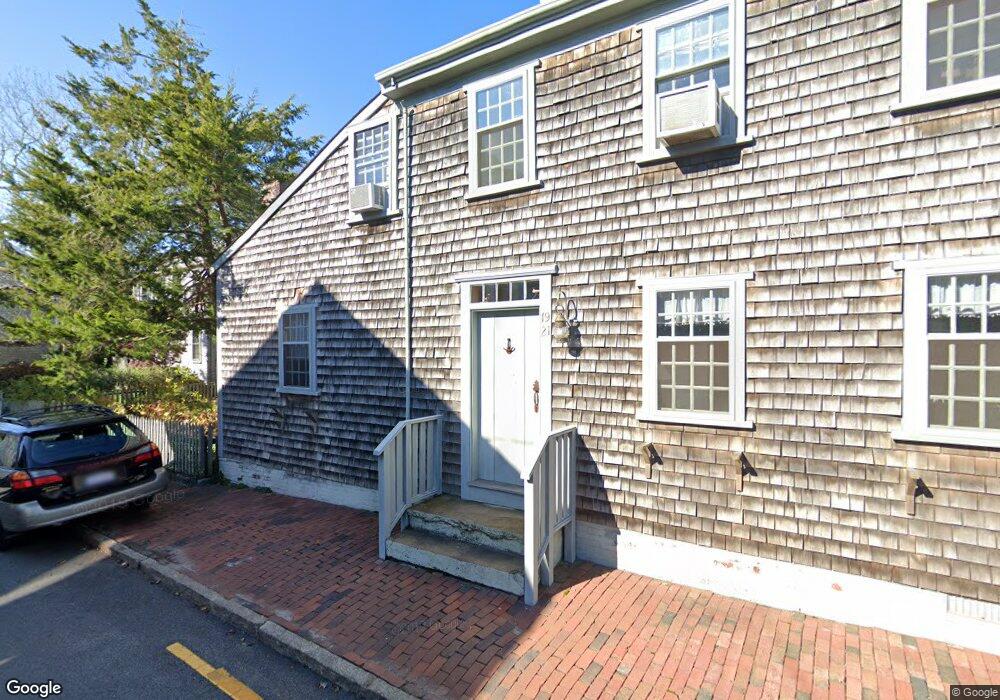
19 Hussey St Nantucket, MA 02554
Estimated Value: $4,734,000
Studio
--
Bath
--
Sq Ft
871
Sq Ft Lot
About This Home
This home is located at 19 Hussey St, Nantucket, MA 02554 and is currently priced at $4,734,000. 19 Hussey St is a home located in Nantucket County with nearby schools including Nantucket Elementary School, Cyrus Peirce Middle School, and Nantucket High School.
Ownership History
Date
Name
Owned For
Owner Type
Purchase Details
Closed on
Aug 29, 2008
Sold by
Robinson Phyllis K
Bought by
Richardson Julie and Richardson Matthew
Current Estimated Value
Purchase Details
Closed on
Jun 16, 1999
Sold by
Jacobson Lawrence S and Jacobson Alice B
Bought by
Robinson Phyllis K
Home Financials for this Owner
Home Financials are based on the most recent Mortgage that was taken out on this home.
Original Mortgage
$200,000
Interest Rate
6.99%
Mortgage Type
Purchase Money Mortgage
Purchase Details
Closed on
Feb 17, 1988
Sold by
Dangelo James M
Bought by
Jacobson Lawrence S
Create a Home Valuation Report for This Property
The Home Valuation Report is an in-depth analysis detailing your home's value as well as a comparison with similar homes in the area
Home Values in the Area
Average Home Value in this Area
Purchase History
| Date | Buyer | Sale Price | Title Company |
|---|---|---|---|
| Richardson Julie | $1,700,000 | -- | |
| Richardson Julie | $1,700,000 | -- | |
| Richardson Julie | $1,700,000 | -- | |
| Robinson Phyllis K | $60,000 | -- | |
| Robinson Phyllis K | $60,000 | -- | |
| Jacobson Lawrence S | $28,000 | -- |
Source: Public Records
Mortgage History
| Date | Status | Borrower | Loan Amount |
|---|---|---|---|
| Previous Owner | Jacobson Lawrence S | $200,000 |
Source: Public Records
Tax History
| Year | Tax Paid | Tax Assessment Tax Assessment Total Assessment is a certain percentage of the fair market value that is determined by local assessors to be the total taxable value of land and additions on the property. | Land | Improvement |
|---|---|---|---|---|
| 2025 | $2,928 | $892,700 | $886,200 | $6,500 |
| 2024 | $2,845 | $909,100 | $902,600 | $6,500 |
| 2023 | $1,914 | $596,200 | $594,000 | $2,200 |
| 2022 | $1,860 | $497,200 | $495,000 | $2,200 |
| 2021 | $1,663 | $458,100 | $455,900 | $2,200 |
| 2020 | $1,580 | $458,100 | $455,900 | $2,200 |
| 2019 | $1,539 | $458,100 | $455,900 | $2,200 |
| 2018 | $1,622 | $459,500 | $455,900 | $3,600 |
| 2017 | $1,558 | $459,500 | $455,900 | $3,600 |
| 2016 | $1,500 | $446,500 | $442,900 | $3,600 |
| 2015 | $1,730 | $479,100 | $473,700 | $5,400 |
| 2014 | $1,587 | $422,200 | $416,800 | $5,400 |
Source: Public Records
Map
Nearby Homes
Your Personal Tour Guide
Ask me questions while you tour the home.