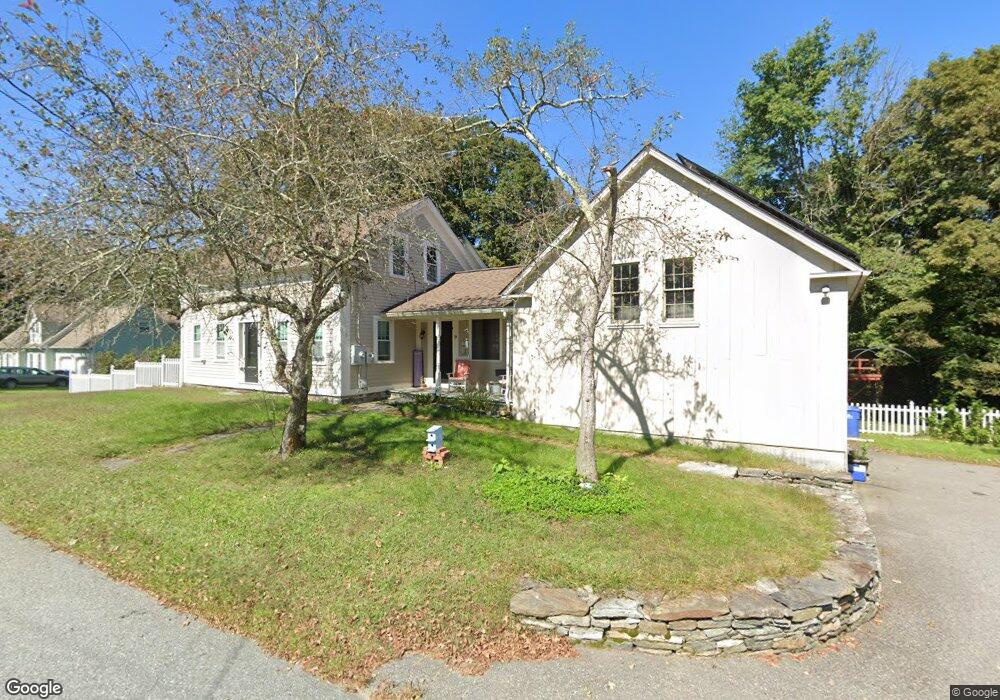
19 Kearney Fork Pomfret Center, CT 06259
Estimated Value: $370,218 - $476,000
3
Beds
1
Bath
1,455
Sq Ft
$285/Sq Ft
Est. Value
About This Home
This home is located at 19 Kearney Fork, Pomfret Center, CT 06259 and is currently estimated at $415,055, approximately $285 per square foot. 19 Kearney Fork is a home located in Windham County with nearby schools including Pomfret Community School, Rectory School, and Pomfret School.
Ownership History
Date
Name
Owned For
Owner Type
Purchase Details
Closed on
Dec 4, 2014
Sold by
Bullied Steven J and Bullied Brenda L
Bought by
Pierce 2Nd David A and Pierce Jennifer G
Current Estimated Value
Home Financials for this Owner
Home Financials are based on the most recent Mortgage that was taken out on this home.
Original Mortgage
$229,591
Outstanding Balance
$178,628
Interest Rate
3.93%
Estimated Equity
$236,427
Purchase Details
Closed on
Jun 25, 1998
Sold by
Kieltyka Renee L
Bought by
Bullied Steven
Home Financials for this Owner
Home Financials are based on the most recent Mortgage that was taken out on this home.
Original Mortgage
$132,050
Interest Rate
7.09%
Mortgage Type
Unknown
Purchase Details
Closed on
Feb 24, 1994
Sold by
Breen Joseph
Bought by
Bouillard Renee
Home Financials for this Owner
Home Financials are based on the most recent Mortgage that was taken out on this home.
Original Mortgage
$111,000
Interest Rate
7.13%
Mortgage Type
Purchase Money Mortgage
Create a Home Valuation Report for This Property
The Home Valuation Report is an in-depth analysis detailing your home's value as well as a comparison with similar homes in the area
Home Values in the Area
Average Home Value in this Area
Purchase History
| Date | Buyer | Sale Price | Title Company |
|---|---|---|---|
| Pierce 2Nd David A | $225,000 | -- | |
| Bullied Steven | $139,000 | -- | |
| Bouillard Renee | $125,000 | -- |
Source: Public Records
Mortgage History
| Date | Status | Borrower | Loan Amount |
|---|---|---|---|
| Open | Bouillard Renee | $229,591 | |
| Previous Owner | Bouillard Renee | $60,000 | |
| Previous Owner | Bouillard Renee | $132,050 | |
| Previous Owner | Bouillard Renee | $111,000 |
Source: Public Records
Tax History Compared to Growth
Tax History
| Year | Tax Paid | Tax Assessment Tax Assessment Total Assessment is a certain percentage of the fair market value that is determined by local assessors to be the total taxable value of land and additions on the property. | Land | Improvement |
|---|---|---|---|---|
| 2025 | $4,784 | $230,800 | $51,800 | $179,000 |
| 2024 | $5,747 | $140,600 | $50,800 | $89,800 |
| 2023 | $3,761 | $140,600 | $50,800 | $89,800 |
| 2022 | $3,760 | $140,600 | $50,800 | $89,800 |
| 2021 | $3,727 | $140,600 | $50,800 | $89,800 |
| 2020 | $4,171 | $151,000 | $57,700 | $93,300 |
| 2019 | $4,104 | $151,000 | $57,700 | $93,300 |
| 2018 | $4,062 | $151,000 | $57,700 | $93,300 |
| 2017 | $4,368 | $151,000 | $57,700 | $93,300 |
| 2016 | $3,866 | $151,000 | $57,700 | $93,300 |
| 2015 | $4,399 | $174,300 | $86,500 | $87,800 |
| 2014 | $4,380 | $174,300 | $86,500 | $87,800 |
Source: Public Records
Map
Nearby Homes
- 384 Killingly Rd
- 48 Wrights Crossing Rd
- 308 Orchard Hill Rd
- 80 Averill Rd
- 357 Wrights Crossing Rd
- 126 Spaulding Rd
- 98 Williamsville Rd
- 97 Blossom Dr
- 7 Shelby Cir
- 2 Hampton Rd
- 4 Bluebird Ln
- 372 Church St
- 177 Barrett Hill Rd
- 1 Jericho Rd
- 93 Jericho Rd
- 3 Ferland Dr
- 11 Kenneth Dr
- 3 Pomfret Rd
- 0 Jericho Rd
- 30 Tyrone Rd
- 25 Kearney Fork
- 11 Kearney Fork
- 26 Kearney Fork
- 14 Kearney Fork
- 188 Killingly Rd
- 31 Kearney Fork
- 29 Kearney Rd
- 10 Kearney Fork
- 37 Kearney Fork
- 160 James St
- 197 Killingly Rd
- 248 Killingly Rd
- 22 Kearney Rd
- 155 James St
- 209 Killingly Rd
- 98 James St
- 46 Kearney Fork
- 18 Kearney Rd
- 189 Killingly Rd Unit 4
- 189 Killingly Rd Unit 3