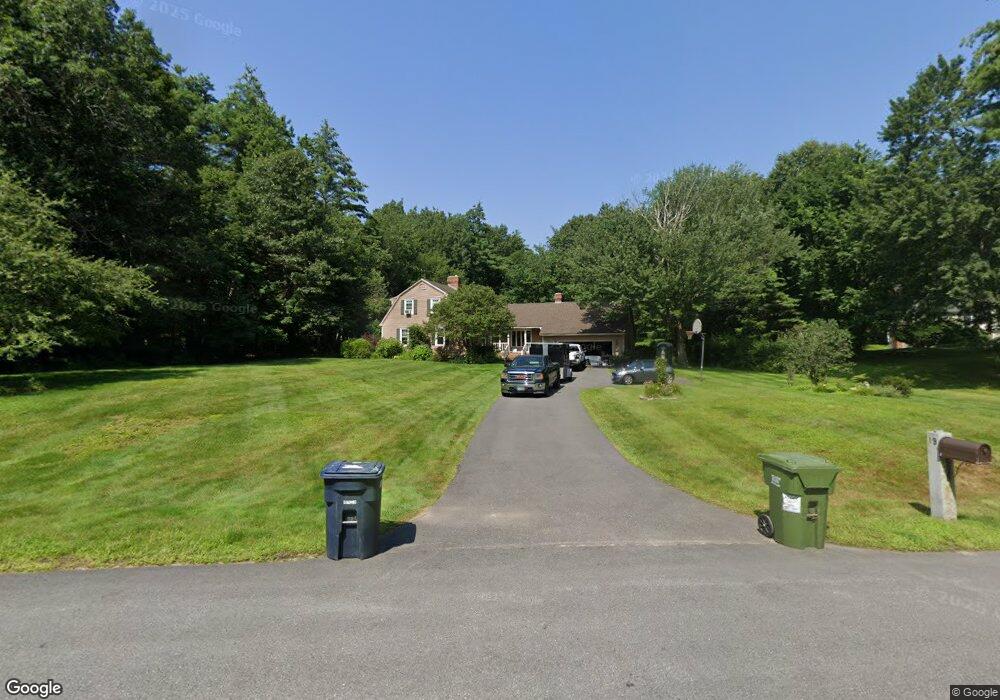
19 Kent St Windham, NH 03087
Estimated Value: $765,571 - $979,000
4
Beds
3
Baths
2,434
Sq Ft
$358/Sq Ft
Est. Value
About This Home
This home is located at 19 Kent St, Windham, NH 03087 and is currently estimated at $872,143, approximately $358 per square foot. 19 Kent St is a home located in Rockingham County with nearby schools including Golden Brook Elementary School, Windham Middle School, and Windham High School.
Ownership History
Date
Name
Owned For
Owner Type
Purchase Details
Closed on
Sep 26, 2002
Sold by
Viveiros Russell and Viveiros Diane
Bought by
Lilienthal Patricia R and Lilienthal Charles P
Current Estimated Value
Home Financials for this Owner
Home Financials are based on the most recent Mortgage that was taken out on this home.
Original Mortgage
$300,700
Outstanding Balance
$126,895
Interest Rate
6.25%
Estimated Equity
$745,248
Create a Home Valuation Report for This Property
The Home Valuation Report is an in-depth analysis detailing your home's value as well as a comparison with similar homes in the area
Home Values in the Area
Average Home Value in this Area
Purchase History
| Date | Buyer | Sale Price | Title Company |
|---|---|---|---|
| Lilienthal Patricia R | $379,000 | -- |
Source: Public Records
Mortgage History
| Date | Status | Borrower | Loan Amount |
|---|---|---|---|
| Open | Lilienthal Patricia R | $300,700 |
Source: Public Records
Tax History
| Year | Tax Paid | Tax Assessment Tax Assessment Total Assessment is a certain percentage of the fair market value that is determined by local assessors to be the total taxable value of land and additions on the property. | Land | Improvement |
|---|---|---|---|---|
| 2024 | $10,670 | $471,300 | $201,900 | $269,400 |
| 2023 | $9,951 | $465,000 | $201,900 | $263,100 |
| 2022 | $9,188 | $465,000 | $201,900 | $263,100 |
| 2021 | $8,658 | $465,000 | $201,900 | $263,100 |
| 2020 | $8,895 | $465,000 | $201,900 | $263,100 |
| 2019 | $8,637 | $383,000 | $185,300 | $197,700 |
| 2018 | $8,976 | $385,400 | $185,300 | $200,100 |
| 2017 | $7,785 | $385,400 | $185,300 | $200,100 |
| 2016 | $8,409 | $385,400 | $185,300 | $200,100 |
| 2015 | $8,371 | $385,400 | $185,300 | $200,100 |
| 2014 | $9,034 | $376,400 | $195,000 | $181,400 |
| 2013 | $8,725 | $369,700 | $195,000 | $174,700 |
Source: Public Records
Map
Nearby Homes
- 14 Londonderry Rd
- 2 Mulberry St
- 106 N Lowell Rd
- 18 Highclere Rd
- 5 Hidden Valley Rd
- 20 Hancock Rd
- 4 Arbor Rd
- 16 Arbor Rd
- 98 Trails Edge Rd
- 39 Overton Rd
- 16 Towne Dr
- 7 Lilac Ridge Rd
- 67 Forest St
- 54 Enterprise Dr
- 44 Sheffield Way Unit 6B
- 6 Chadwick Cir
- 41 Derryfield Rd
- 5 Elise Ave Unit Lot 94
- 6 Michael Ave
- 13 Kilrea Rd Unit L
Your Personal Tour Guide
Ask me questions while you tour the home.