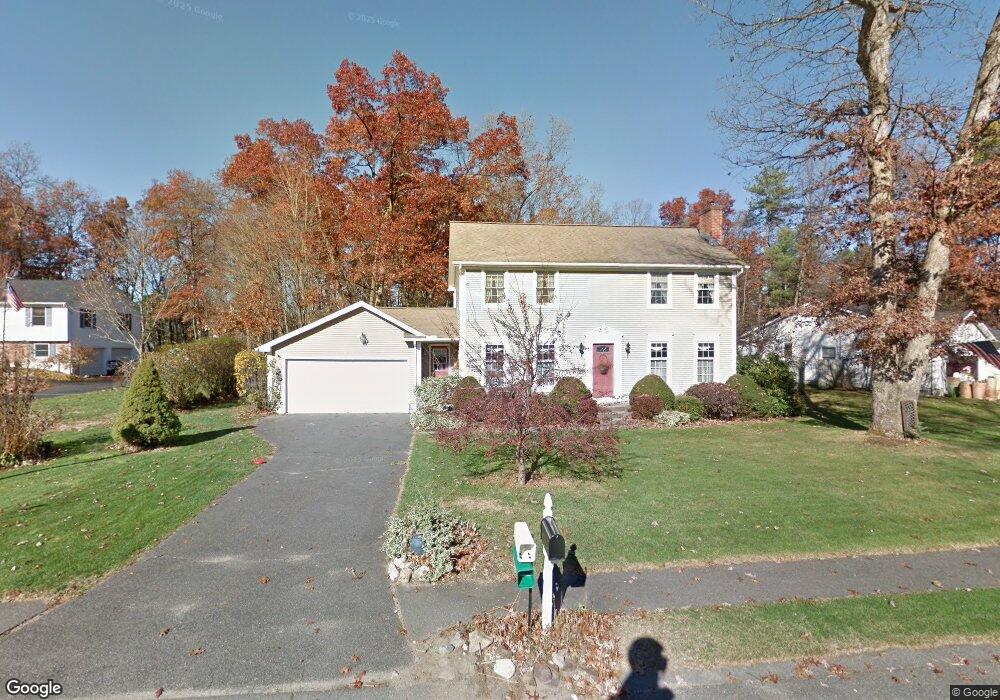
19 Kimberly Ln Easthampton, MA 01027
Estimated Value: $483,109 - $521,000
3
Beds
2
Baths
1,846
Sq Ft
$272/Sq Ft
Est. Value
About This Home
This home is located at 19 Kimberly Ln, Easthampton, MA 01027 and is currently estimated at $502,027, approximately $271 per square foot. 19 Kimberly Ln is a home located in Hampshire County with nearby schools including Easthampton High School, Calvary Baptist Christian School, and Tri-County Schools.
Ownership History
Date
Name
Owned For
Owner Type
Purchase Details
Closed on
Sep 11, 2024
Sold by
Beaulieu Joey and Beaulieu Celeste T
Bought by
Provost Nicole
Current Estimated Value
Purchase Details
Closed on
Dec 18, 1992
Sold by
Sunnyside Dev Corp
Bought by
Beaulieu Celeste T and Beaulieu Joey
Create a Home Valuation Report for This Property
The Home Valuation Report is an in-depth analysis detailing your home's value as well as a comparison with similar homes in the area
Home Values in the Area
Average Home Value in this Area
Purchase History
| Date | Buyer | Sale Price | Title Company |
|---|---|---|---|
| Provost Nicole | -- | None Available | |
| Provost Nicole | -- | None Available | |
| Beaulieu Celeste T | $134,900 | -- | |
| Beaulieu Celeste T | $134,900 | -- |
Source: Public Records
Mortgage History
| Date | Status | Borrower | Loan Amount |
|---|---|---|---|
| Previous Owner | Beaulieu Celeste T | $16,000 | |
| Previous Owner | Beaulieu Celeste T | $88,000 | |
| Previous Owner | Beaulieu Celeste T | $100,600 |
Source: Public Records
Tax History Compared to Growth
Tax History
| Year | Tax Paid | Tax Assessment Tax Assessment Total Assessment is a certain percentage of the fair market value that is determined by local assessors to be the total taxable value of land and additions on the property. | Land | Improvement |
|---|---|---|---|---|
| 2025 | $6,102 | $446,400 | $120,700 | $325,700 |
| 2024 | $5,882 | $433,800 | $117,200 | $316,600 |
| 2023 | $4,395 | $300,000 | $92,200 | $207,800 |
| 2022 | $4,959 | $300,000 | $92,200 | $207,800 |
| 2021 | $5,460 | $311,300 | $92,200 | $219,100 |
| 2020 | $5,328 | $300,000 | $92,200 | $207,800 |
| 2019 | $4,374 | $282,900 | $92,200 | $190,700 |
| 2018 | $4,203 | $262,700 | $86,900 | $175,800 |
| 2017 | $4,100 | $252,900 | $83,500 | $169,400 |
| 2016 | $4,097 | $262,800 | $83,500 | $179,300 |
| 2015 | $3,981 | $262,800 | $83,500 | $179,300 |
Source: Public Records
Map
Nearby Homes