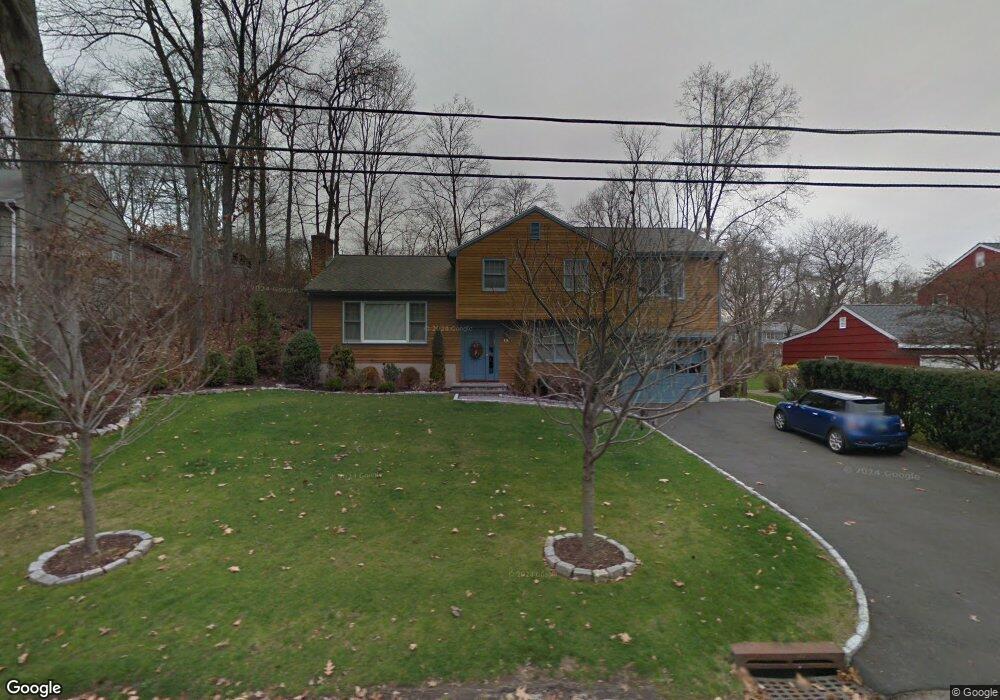
19 Lancer Rd Riverside, CT 06878
Estimated Value: $1,818,981 - $2,303,000
4
Beds
3
Baths
2,485
Sq Ft
$796/Sq Ft
Est. Value
About This Home
This home is located at 19 Lancer Rd, Riverside, CT 06878 and is currently estimated at $1,976,995, approximately $795 per square foot. 19 Lancer Rd is a home located in Fairfield County with nearby schools including North Mianus School, Eastern Middle School, and Greenwich High School.
Ownership History
Date
Name
Owned For
Owner Type
Purchase Details
Closed on
Jun 28, 2023
Sold by
Pfetsch Friedrich K and Pfetsch Anne
Bought by
Anne Pfetsch Ret and Pfetsch
Current Estimated Value
Purchase Details
Closed on
Jul 30, 1992
Sold by
Walsh Richard
Bought by
Pfetsch Friedrich and Pfetsch Anne
Create a Home Valuation Report for This Property
The Home Valuation Report is an in-depth analysis detailing your home's value as well as a comparison with similar homes in the area
Home Values in the Area
Average Home Value in this Area
Purchase History
| Date | Buyer | Sale Price | Title Company |
|---|---|---|---|
| Anne Pfetsch Ret | -- | None Available | |
| Pfetsch Friedrich | $375,000 | -- |
Source: Public Records
Mortgage History
| Date | Status | Borrower | Loan Amount |
|---|---|---|---|
| Previous Owner | Pfetsch Friedrich | $900,000 | |
| Previous Owner | Pfetsch Friedrich | $625,000 |
Source: Public Records
Tax History
| Year | Tax Paid | Tax Assessment Tax Assessment Total Assessment is a certain percentage of the fair market value that is determined by local assessors to be the total taxable value of land and additions on the property. | Land | Improvement |
|---|---|---|---|---|
| 2025 | $8,899 | $720,020 | $512,120 | $207,900 |
| 2024 | $8,594 | $720,020 | $512,120 | $207,900 |
| 2023 | $8,378 | $720,020 | $512,120 | $207,900 |
| 2022 | $8,302 | $720,020 | $512,120 | $207,900 |
| 2021 | $7,881 | $654,570 | $440,160 | $214,410 |
| 2020 | $7,868 | $654,570 | $440,160 | $214,410 |
| 2019 | $7,946 | $654,570 | $440,160 | $214,410 |
| 2018 | $7,770 | $654,570 | $440,160 | $214,410 |
| 2017 | $7,867 | $654,570 | $440,160 | $214,410 |
| 2016 | $7,627 | $644,770 | $440,160 | $204,610 |
| 2015 | $7,527 | $631,190 | $490,840 | $140,350 |
| 2014 | $7,338 | $631,190 | $490,840 | $140,350 |
Source: Public Records
Map
Nearby Homes
- 112 Sheephill Rd
- 45 Sunshine Ave
- 5 Sunshine Ave
- 120 Florence Rd
- 33 Halsey Dr
- 98 Hillcrest Park Rd
- 23 Thornhill Rd
- 9 Stuart Dr
- 1535 E Putnam Ave Unit 304
- 1535 E Putnam Ave Unit 205
- 1535 E Putnam Ave Unit 307
- 23 Westview Place
- 24 Decatur St Unit 2
- 77 Havemeyer Ln Unit 301
- 77 Havemeyer Ln Unit 58
- 420 Valley Rd
- 20 Sound Beach Ave
- 45 Hillcrest Park Rd
- 45 Hillcrest Park Rd
- 17 Maple Dr
Your Personal Tour Guide
Ask me questions while you tour the home.