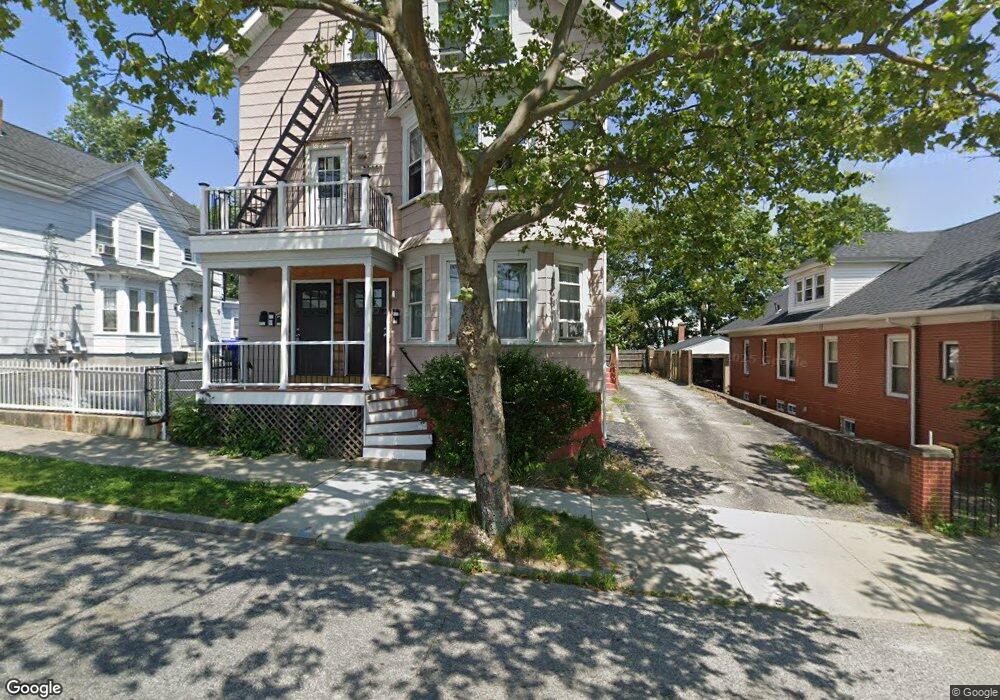
19 Langdon St Providence, RI 02904
Charles NeighborhoodEstimated Value: $623,000 - $677,000
3
Beds
3
Baths
950
Sq Ft
$684/Sq Ft
Est. Value
About This Home
This home is located at 19 Langdon St, Providence, RI 02904 and is currently estimated at $650,000, approximately $684 per square foot. 19 Langdon St is a home located in Providence County with nearby schools including Times Squared Academy, Paul Cuffee Charter School, and Times2 Middle/High School.
Ownership History
Date
Name
Owned For
Owner Type
Purchase Details
Closed on
Nov 30, 2018
Sold by
Vicioso Rosendo
Bought by
Vicioso Rosendo and Vicioso Hircanys
Current Estimated Value
Purchase Details
Closed on
Mar 31, 2014
Sold by
Transland Llc
Bought by
Vicioso Rosendo
Purchase Details
Closed on
Nov 13, 2009
Sold by
Terino Gerard P
Bought by
Transland Llc
Create a Home Valuation Report for This Property
The Home Valuation Report is an in-depth analysis detailing your home's value as well as a comparison with similar homes in the area
Home Values in the Area
Average Home Value in this Area
Purchase History
| Date | Buyer | Sale Price | Title Company |
|---|---|---|---|
| Vicioso Rosendo | -- | -- | |
| Vicioso Rosendo | -- | -- | |
| Transland Llc | $87,100 | -- |
Source: Public Records
Mortgage History
| Date | Status | Borrower | Loan Amount |
|---|---|---|---|
| Previous Owner | Transland Llc | $65,000 | |
| Previous Owner | Transland Llc | $90,000 | |
| Previous Owner | Transland Llc | $73,800 |
Source: Public Records
Tax History
| Year | Tax Paid | Tax Assessment Tax Assessment Total Assessment is a certain percentage of the fair market value that is determined by local assessors to be the total taxable value of land and additions on the property. | Land | Improvement |
|---|---|---|---|---|
| 2025 | $3,496 | $463,000 | $129,500 | $333,500 |
| 2024 | $5,698 | $310,500 | $85,000 | $225,500 |
| 2023 | $5,698 | $310,500 | $85,000 | $225,500 |
| 2022 | $5,527 | $310,500 | $85,000 | $225,500 |
| 2021 | $5,256 | $214,000 | $64,200 | $149,800 |
| 2020 | $5,256 | $214,000 | $64,200 | $149,800 |
| 2019 | $5,256 | $214,000 | $64,200 | $149,800 |
| 2018 | $4,449 | $139,200 | $49,600 | $89,600 |
| 2017 | $4,449 | $139,200 | $49,600 | $89,600 |
| 2016 | $4,449 | $139,200 | $49,600 | $89,600 |
| 2015 | $3,972 | $120,000 | $50,200 | $69,800 |
| 2014 | $4,050 | $120,000 | $50,200 | $69,800 |
| 2013 | $4,050 | $120,000 | $50,200 | $69,800 |
Source: Public Records
Map
Nearby Homes
- 17 Langdon St
- 27 Langdon St
- 31 Langdon St
- 114 Greeley St
- 35 Langdon St
- 81 Monticello St
- 24 Langdon St
- 0 Langdon St Unit 1074557
- 0 Langdon St Unit 1097825
- 0 Langdon St Unit 1105795
- 0 Langdon St Unit 1113461
- 0 Langdon St Unit 1119050
- 36 Langdon St
- 78 Greeley St Unit 4
- 78 Greeley St Unit 3
- 78 Greeley St
- 78 Greeley St Unit 78
- 41 Langdon St
- 41R Langdon St
- 80 Greeley St Unit 80
Your Personal Tour Guide
Ask me questions while you tour the home.