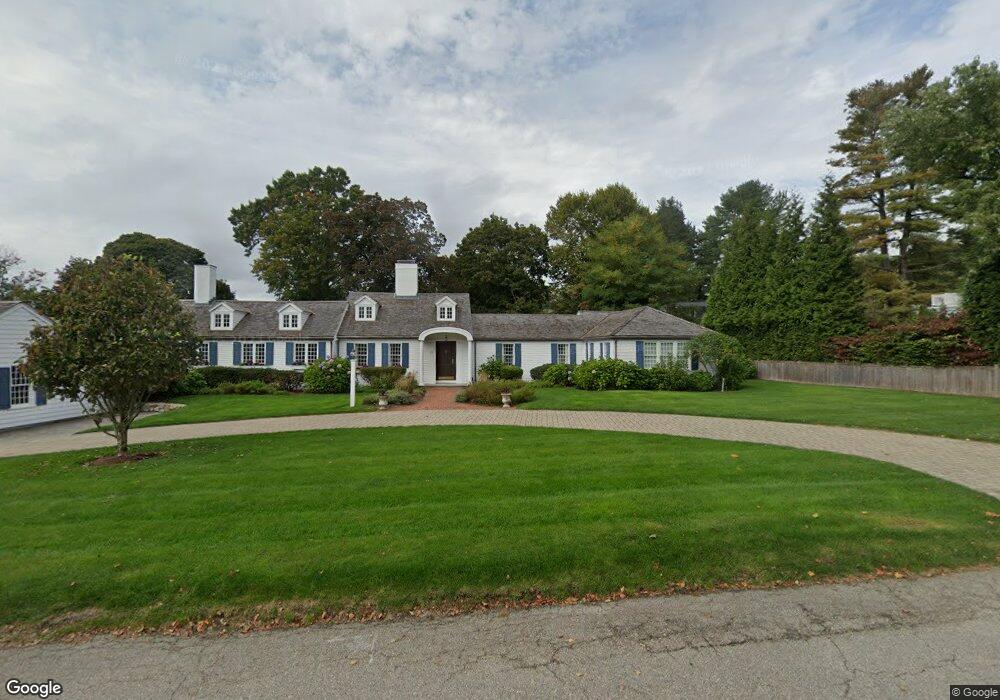
19 Lansing Rd West Newton, MA 02465
West Newton NeighborhoodEstimated Value: $3,130,000 - $5,028,000
5
Beds
4
Baths
4,303
Sq Ft
$998/Sq Ft
Est. Value
About This Home
This home is located at 19 Lansing Rd, West Newton, MA 02465 and is currently estimated at $4,292,794, approximately $997 per square foot. 19 Lansing Rd is a home located in Middlesex County with nearby schools including Peirce Elementary School, F.A. Day Middle School, and Newton North High School.
Ownership History
Date
Name
Owned For
Owner Type
Purchase Details
Closed on
Sep 9, 1997
Sold by
Paquin Helen D
Bought by
Bornhorst Walter and Bornhorst Marina H
Current Estimated Value
Home Financials for this Owner
Home Financials are based on the most recent Mortgage that was taken out on this home.
Original Mortgage
$912,000
Interest Rate
7.36%
Mortgage Type
Purchase Money Mortgage
Purchase Details
Closed on
May 24, 1994
Sold by
Est Mcfarland Alex J and Condit Edward M
Bought by
Paquin Helene D
Home Financials for this Owner
Home Financials are based on the most recent Mortgage that was taken out on this home.
Original Mortgage
$350,000
Interest Rate
8.51%
Create a Home Valuation Report for This Property
The Home Valuation Report is an in-depth analysis detailing your home's value as well as a comparison with similar homes in the area
Home Values in the Area
Average Home Value in this Area
Purchase History
| Date | Buyer | Sale Price | Title Company |
|---|---|---|---|
| Bornhorst Walter | $1,020,000 | -- | |
| Paquin Helene D | $679,000 | -- |
Source: Public Records
Mortgage History
| Date | Status | Borrower | Loan Amount |
|---|---|---|---|
| Open | Paquin Helene D | $903,000 | |
| Closed | Paquin Helene D | $912,000 | |
| Previous Owner | Paquin Helene D | $350,000 |
Source: Public Records
Tax History Compared to Growth
Tax History
| Year | Tax Paid | Tax Assessment Tax Assessment Total Assessment is a certain percentage of the fair market value that is determined by local assessors to be the total taxable value of land and additions on the property. | Land | Improvement |
|---|---|---|---|---|
| 2025 | $40,894 | $4,172,900 | $1,910,700 | $2,262,200 |
| 2024 | $42,302 | $4,334,200 | $1,947,700 | $2,386,500 |
| 2023 | $40,628 | $3,991,000 | $1,561,600 | $2,429,400 |
| 2022 | $38,876 | $3,695,400 | $1,445,900 | $2,249,500 |
| 2021 | $37,512 | $3,486,200 | $1,364,100 | $2,122,100 |
| 2020 | $36,396 | $3,486,200 | $1,364,100 | $2,122,100 |
| 2019 | $35,370 | $3,384,700 | $1,324,400 | $2,060,300 |
| 2018 | $34,100 | $3,151,600 | $1,184,100 | $1,967,500 |
| 2017 | $33,062 | $2,973,200 | $1,117,100 | $1,856,100 |
| 2016 | $31,622 | $2,778,700 | $1,044,000 | $1,734,700 |
| 2015 | $30,150 | $2,596,900 | $975,700 | $1,621,200 |
Source: Public Records
Map
Nearby Homes
- 10 Ruane Rd
- 443 Chestnut St
- 68 Mignon Rd
- 479 Chestnut St
- 279 Chestnut St
- 513 Chestnut St
- 222 Prince St
- 115 Windsor Rd
- 18 Sewall St
- 29 Montclair Rd
- 39 Valentine Park
- 36 Troy Ln
- 308 Prince St
- 1754 Washington St
- 163 Day St
- 1639 Washington St
- 1430 Beacon St
- 121 Dorset Rd
- 1230 Commonwealth Ave
- 283 Woodland Rd