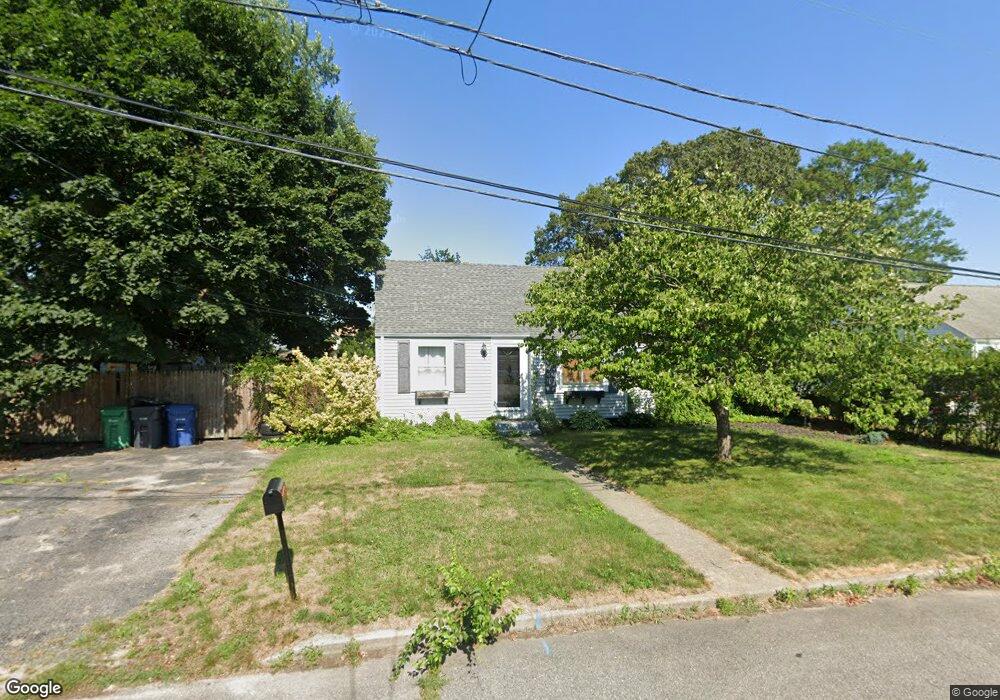
19 Lydick Ave Warwick, RI 02888
Spring Green NeighborhoodEstimated Value: $395,174 - $443,000
3
Beds
1
Bath
1,571
Sq Ft
$265/Sq Ft
Est. Value
About This Home
This home is located at 19 Lydick Ave, Warwick, RI 02888 and is currently estimated at $416,044, approximately $264 per square foot. 19 Lydick Ave is a home located in Kent County with nearby schools including St. Peter School.
Ownership History
Date
Name
Owned For
Owner Type
Purchase Details
Closed on
Jan 14, 2025
Sold by
Raposo Allen and Turcotte-Raposo Tammy
Bought by
Raposo Allen
Current Estimated Value
Purchase Details
Closed on
Jan 23, 2004
Sold by
Raposo Joao A and Raposo Maria B
Bought by
Raposo Allen
Purchase Details
Closed on
Nov 4, 2002
Sold by
Dutchover Elaine F
Bought by
Rapooo Joao A and Rapooo Maria B
Purchase Details
Closed on
Apr 24, 1995
Sold by
Tift David A and Tift Denise
Bought by
Young Elaine F
Create a Home Valuation Report for This Property
The Home Valuation Report is an in-depth analysis detailing your home's value as well as a comparison with similar homes in the area
Home Values in the Area
Average Home Value in this Area
Purchase History
| Date | Buyer | Sale Price | Title Company |
|---|---|---|---|
| Raposo Allen | -- | None Available | |
| Raposo Allen | -- | None Available | |
| Raposo Allen | $200,000 | -- | |
| Raposo Allen | $200,000 | -- | |
| Rapooo Joao A | $153,500 | -- | |
| Rapooo Joao A | $153,500 | -- | |
| Young Elaine F | $93,000 | -- | |
| Young Elaine F | $93,000 | -- |
Source: Public Records
Mortgage History
| Date | Status | Borrower | Loan Amount |
|---|---|---|---|
| Previous Owner | Young Elaine F | $37,000 | |
| Previous Owner | Young Elaine F | $193,500 |
Source: Public Records
Tax History
| Year | Tax Paid | Tax Assessment Tax Assessment Total Assessment is a certain percentage of the fair market value that is determined by local assessors to be the total taxable value of land and additions on the property. | Land | Improvement |
|---|---|---|---|---|
| 2025 | $4,238 | $333,700 | $108,800 | $224,900 |
| 2024 | $4,047 | $279,700 | $94,600 | $185,100 |
| 2023 | $3,969 | $279,700 | $94,600 | $185,100 |
| 2022 | $3,684 | $196,700 | $58,000 | $138,700 |
| 2021 | $3,684 | $196,700 | $58,000 | $138,700 |
| 2020 | $3,684 | $196,700 | $58,000 | $138,700 |
| 2019 | $3,684 | $196,700 | $58,000 | $138,700 |
| 2018 | $2,999 | $144,200 | $51,600 | $92,600 |
| 2017 | $2,919 | $144,200 | $51,600 | $92,600 |
| 2016 | $2,919 | $144,200 | $51,600 | $92,600 |
| 2015 | $2,754 | $132,700 | $57,200 | $75,500 |
| 2014 | $2,662 | $132,700 | $57,200 | $75,500 |
| 2013 | $2,626 | $132,700 | $57,200 | $75,500 |
Source: Public Records
Map
Nearby Homes
- 20 Commodore Ave
- 39 Holiday Ave
- 213 Easton Ave
- 15 Christopher Rhodes Way
- 6 Christopher Rhodes Way
- 52 Dahlia St
- 33 Recess Ln
- 49 Recess Ln
- 14 Recess Ln
- 12 Dean Ct
- 72 W Shore Rd Unit 104
- 72 W Shore Rd Unit 3
- 21 Sarah Ln
- 55 Dixie Ave
- 63 Benbridge Ave
- 1020 Warwick Ave
- 48 Rowe Ave
- 80 Twin Oak Dr
- 1052 Post Rd
- 44 Woodstock Dr
Your Personal Tour Guide
Ask me questions while you tour the home.