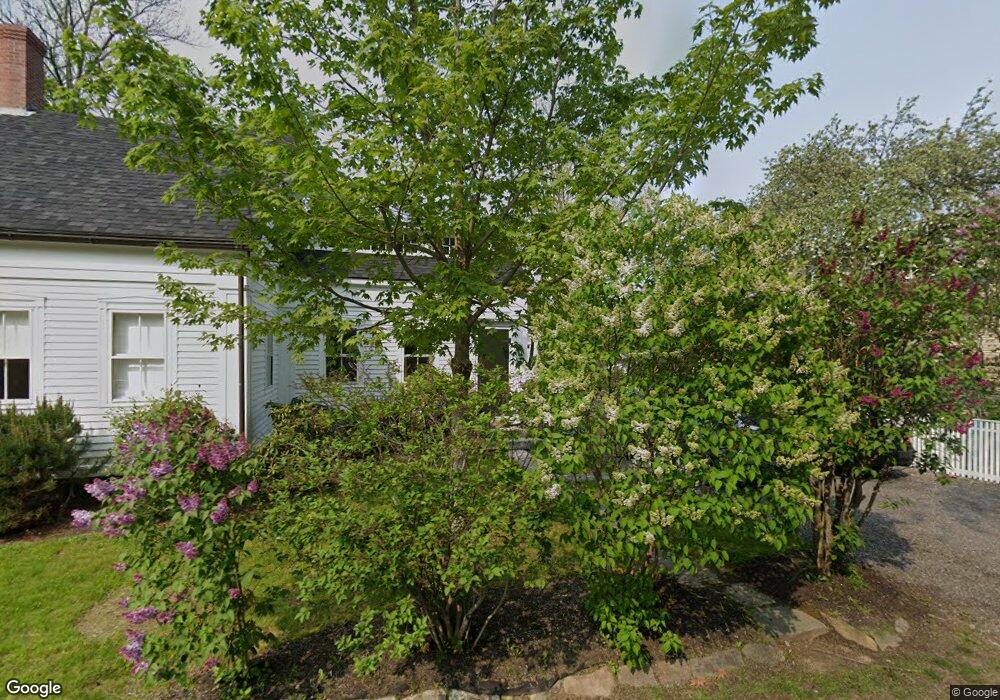
19 Main St Freeport, ME 04032
Estimated Value: $924,000 - $1,362,000
3
Beds
2
Baths
2,301
Sq Ft
$490/Sq Ft
Est. Value
About This Home
This home is located at 19 Main St, Freeport, ME 04032 and is currently estimated at $1,127,098, approximately $489 per square foot. 19 Main St is a home located in Cumberland County with nearby schools including Morse Street School, Mast Landing School, and Freeport Middle School.
Ownership History
Date
Name
Owned For
Owner Type
Purchase Details
Closed on
Jul 26, 2016
Sold by
Fischman Charles B
Bought by
Fairhurst John and Semanyshyn Christina
Current Estimated Value
Home Financials for this Owner
Home Financials are based on the most recent Mortgage that was taken out on this home.
Original Mortgage
$288,000
Outstanding Balance
$227,571
Interest Rate
3.6%
Mortgage Type
New Conventional
Estimated Equity
$899,527
Purchase Details
Closed on
Jul 24, 2015
Sold by
Strout Bradford H Est and Strout
Bought by
Manchester Pt and Manchester M
Create a Home Valuation Report for This Property
The Home Valuation Report is an in-depth analysis detailing your home's value as well as a comparison with similar homes in the area
Home Values in the Area
Average Home Value in this Area
Purchase History
| Date | Buyer | Sale Price | Title Company |
|---|---|---|---|
| Fairhurst John | -- | -- | |
| Manchester Pt | -- | -- |
Source: Public Records
Mortgage History
| Date | Status | Borrower | Loan Amount |
|---|---|---|---|
| Open | Fairhurst John | $288,000 |
Source: Public Records
Tax History
| Year | Tax Paid | Tax Assessment Tax Assessment Total Assessment is a certain percentage of the fair market value that is determined by local assessors to be the total taxable value of land and additions on the property. | Land | Improvement |
|---|---|---|---|---|
| 2024 | $12,297 | $921,100 | $548,100 | $373,000 |
| 2023 | $11,300 | $821,800 | $498,200 | $323,600 |
| 2022 | $10,489 | $768,400 | $444,800 | $323,600 |
| 2021 | $10,900 | $816,500 | $550,500 | $266,000 |
| 2020 | $10,634 | $759,600 | $509,700 | $249,900 |
| 2019 | $10,203 | $713,500 | $480,900 | $232,600 |
| 2018 | $9,596 | $637,600 | $422,300 | $215,300 |
| 2017 | $8,922 | $596,800 | $391,500 | $205,300 |
| 2016 | $8,625 | $545,900 | $355,400 | $190,500 |
| 2015 | $8,351 | $497,100 | $329,300 | $167,800 |
| 2014 | $7,854 | $497,100 | $329,300 | $167,800 |
| 2013 | $7,749 | $488,900 | $304,900 | $184,000 |
Source: Public Records
Map
Nearby Homes
- 20 Harvest Ridge Rd Unit 23
- 26 Harvest Ridge Rd Unit 24
- 15 Linwood Rd Unit 15
- 67 Farmview Ln
- 58 Maquoit Dr
- 200 Sisquisic Trail
- 10 Durham Rd
- 212 Main St
- 11 Orchard Hill Rd
- 203 Bluff Rd Unit 13
- 42 Durham Rd
- 5 Arrowhead Ridge Rd
- 9 Gables Dr Unit 9
- 52 Blueberry Cove Rd Unit 52
- 304 Pownal Rd
- 0 Bayview St
- 172 E Main St
- 6 Daybreak Ln Unit 18
- 109 Melissa Dr
- 16 Rocky Hill Rd
Your Personal Tour Guide
Ask me questions while you tour the home.