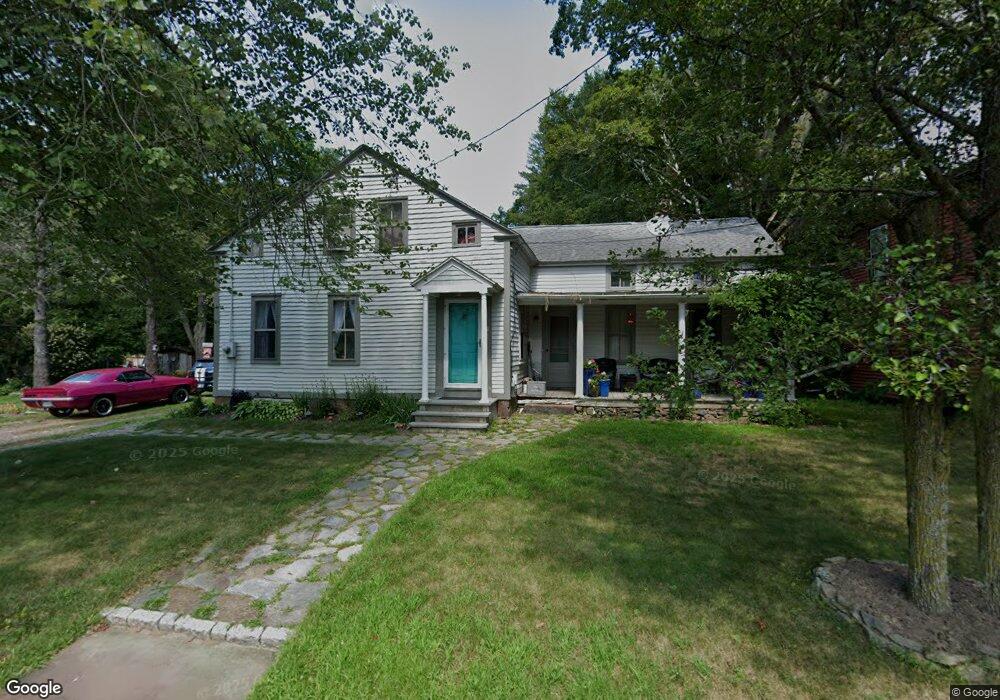
19 Maple St Somers, CT 06071
Estimated Value: $250,000 - $358,000
4
Beds
2
Baths
1,898
Sq Ft
$158/Sq Ft
Est. Value
About This Home
This home is located at 19 Maple St, Somers, CT 06071 and is currently estimated at $299,953, approximately $158 per square foot. 19 Maple St is a home located in Tolland County with nearby schools including Somers Elementary School, Mabelle B. Avery Middle School, and Somers High School.
Ownership History
Date
Name
Owned For
Owner Type
Purchase Details
Closed on
Mar 9, 2012
Sold by
Crease Angela M
Bought by
Somers Town Of
Current Estimated Value
Purchase Details
Closed on
Jun 8, 2010
Sold by
Worthington George
Bought by
Crease Angela
Purchase Details
Closed on
Jan 18, 2005
Sold by
Collins John and Collins Mavis
Bought by
Worthington Angela and Worthington George
Home Financials for this Owner
Home Financials are based on the most recent Mortgage that was taken out on this home.
Original Mortgage
$124,154
Interest Rate
5.81%
Create a Home Valuation Report for This Property
The Home Valuation Report is an in-depth analysis detailing your home's value as well as a comparison with similar homes in the area
Home Values in the Area
Average Home Value in this Area
Purchase History
| Date | Buyer | Sale Price | Title Company |
|---|---|---|---|
| Somers Town Of | $10,730 | -- | |
| Somers Town Of | $10,730 | -- | |
| Crease Angela | -- | -- | |
| Crease Angela | -- | -- | |
| Worthington Angela | $124,900 | -- | |
| Worthington Angela | $124,900 | -- |
Source: Public Records
Mortgage History
| Date | Status | Borrower | Loan Amount |
|---|---|---|---|
| Previous Owner | Worthington Angela | $124,154 |
Source: Public Records
Tax History
| Year | Tax Paid | Tax Assessment Tax Assessment Total Assessment is a certain percentage of the fair market value that is determined by local assessors to be the total taxable value of land and additions on the property. | Land | Improvement |
|---|---|---|---|---|
| 2025 | $3,607 | $119,400 | $51,000 | $68,400 |
| 2024 | $3,458 | $119,400 | $51,000 | $68,400 |
| 2023 | $3,380 | $119,400 | $51,000 | $68,400 |
| 2022 | $3,291 | $119,400 | $51,000 | $68,400 |
| 2021 | $3,183 | $119,400 | $51,000 | $68,400 |
| 2020 | $3,011 | $110,000 | $51,000 | $59,000 |
| 2019 | $2,833 | $103,500 | $53,700 | $49,800 |
| 2018 | $2,833 | $103,500 | $53,700 | $49,800 |
| 2017 | $2,636 | $103,500 | $53,700 | $49,800 |
| 2016 | $2,507 | $103,500 | $53,700 | $49,800 |
| 2015 | $3,080 | $131,800 | $62,200 | $69,600 |
| 2014 | $3,080 | $131,800 | $62,200 | $69,600 |
Source: Public Records
Map
Nearby Homes
- 20 Shaker Rd
- 50 Nutmeg Dr Unit 50
- 139 Hall Hill Rd
- 10 Bailey Rd
- 80 Brewster Rd
- 969 Main St
- 63 Maple Ridge Dr
- 45 Monroe Rd
- 5 Cantlewood Dr
- 32 N Maple St
- 557 Hall Hill Rd
- 287 Hazard Ave
- 171 Abbe Rd
- 11 King Rd
- 603 Hall Hill Rd
- 369 Turnpike Rd
- 659 Hall Hill Rd
- 56 Brittany Ln
- 142 Turnpike Rd
- 64 Somerset Ln
Your Personal Tour Guide
Ask me questions while you tour the home.