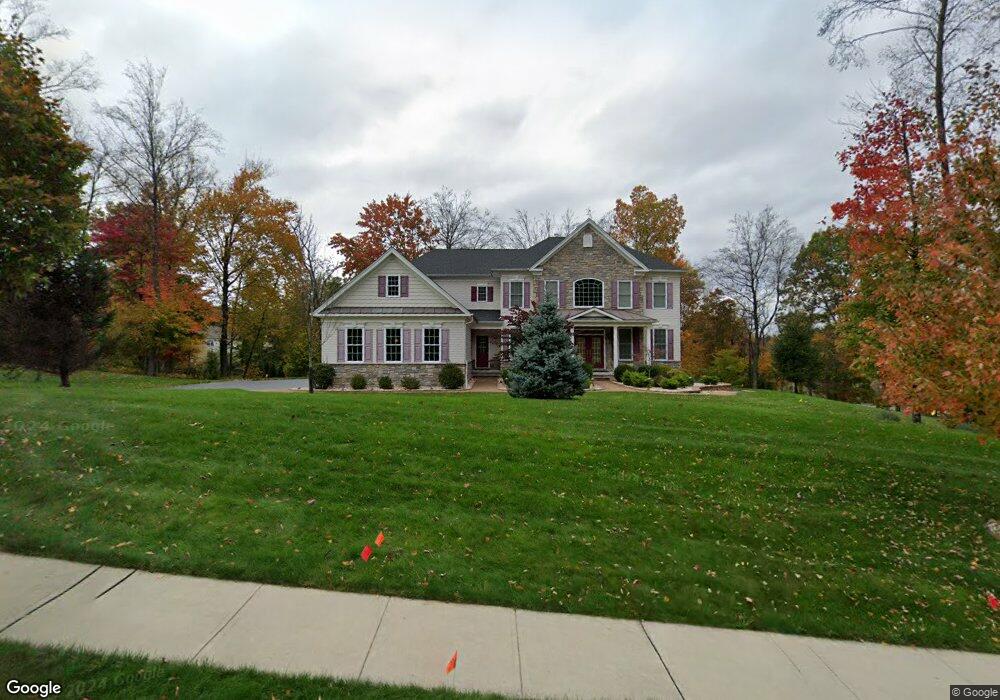
19 Marcin Way Flanders, NJ 07836
Estimated Value: $1,128,000 - $1,231,000
--
Bed
--
Bath
4,272
Sq Ft
$274/Sq Ft
Est. Value
About This Home
This home is located at 19 Marcin Way, Flanders, NJ 07836 and is currently estimated at $1,172,103, approximately $274 per square foot. 19 Marcin Way is a home with nearby schools including Mt Olive Middle School and Mount Olive High School.
Ownership History
Date
Name
Owned For
Owner Type
Purchase Details
Closed on
Jan 28, 2015
Sold by
Toll Nj I Llc
Bought by
Ruvolo Eduardo Colla and Teofilo Ruvolo Maria Suely Dos Reis
Current Estimated Value
Home Financials for this Owner
Home Financials are based on the most recent Mortgage that was taken out on this home.
Original Mortgage
$340,000
Outstanding Balance
$260,894
Interest Rate
3.81%
Mortgage Type
New Conventional
Estimated Equity
$911,209
Create a Home Valuation Report for This Property
The Home Valuation Report is an in-depth analysis detailing your home's value as well as a comparison with similar homes in the area
Home Values in the Area
Average Home Value in this Area
Purchase History
| Date | Buyer | Sale Price | Title Company |
|---|---|---|---|
| Ruvolo Eduardo Colla | $848,192 | None Available |
Source: Public Records
Mortgage History
| Date | Status | Borrower | Loan Amount |
|---|---|---|---|
| Open | Ruvolo Eduardo Colla | $340,000 |
Source: Public Records
Tax History Compared to Growth
Tax History
| Year | Tax Paid | Tax Assessment Tax Assessment Total Assessment is a certain percentage of the fair market value that is determined by local assessors to be the total taxable value of land and additions on the property. | Land | Improvement |
|---|---|---|---|---|
| 2025 | $21,788 | $625,200 | $158,600 | $466,600 |
| 2024 | $20,550 | $625,200 | $158,600 | $466,600 |
| 2023 | $20,550 | $625,200 | $158,600 | $466,600 |
| 2022 | $20,994 | $625,200 | $158,600 | $466,600 |
| 2021 | $20,994 | $625,200 | $158,600 | $466,600 |
| 2020 | $20,713 | $625,200 | $158,600 | $466,600 |
| 2019 | $20,644 | $625,200 | $158,600 | $466,600 |
| 2018 | $20,444 | $625,200 | $158,600 | $466,600 |
| 2017 | $20,088 | $625,200 | $158,600 | $466,600 |
| 2016 | $19,326 | $621,200 | $158,600 | $462,600 |
| 2015 | $19,702 | $79,300 | $79,300 | $0 |
| 2014 | $2,450 | $79,300 | $79,300 | $0 |
Source: Public Records
Map
Nearby Homes
- 139 Flanders Netcong Rd
- 5 Fennimore Ct
- 11 Southwind Dr
- 66 Swackhammer Way
- 48 Old Budd Lake Rd
- 16 Old Ledgewood Rd
- 21 Mount Olive Rd
- 19 Amos Way
- 7 Flanders Rd
- 25 Budd Ave
- 4 Spring St
- 43 Terrace St
- 4 1st St
- 45 Terrace St
- 10 Eisenhower St
- 14 Stonewald Rd
- 10 2nd St
- 250 Route 46
- 146 U S Highway 206
- 23 Amendola Dr