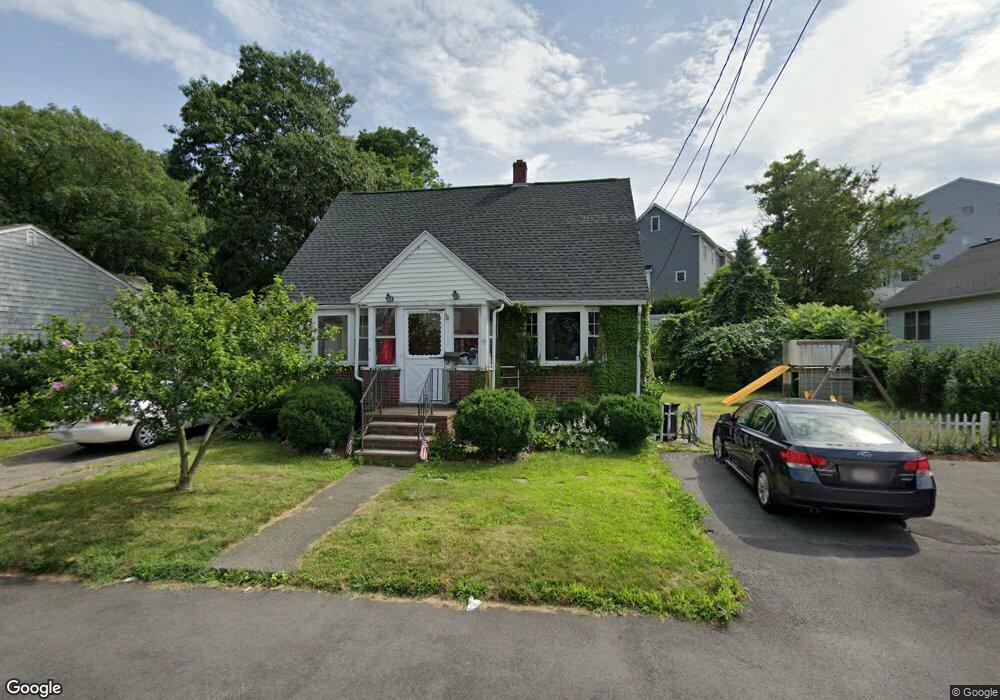
19 Martensen St Quincy, MA 02169
Quincy Point NeighborhoodEstimated Value: $624,000 - $698,000
2
Beds
3
Baths
1,578
Sq Ft
$418/Sq Ft
Est. Value
About This Home
This home is located at 19 Martensen St, Quincy, MA 02169 and is currently estimated at $660,014, approximately $418 per square foot. 19 Martensen St is a home located in Norfolk County with nearby schools including Point Webster Middle School, Clifford H. Marshall Elementary School, and Quincy High School.
Ownership History
Date
Name
Owned For
Owner Type
Purchase Details
Closed on
Dec 18, 2024
Sold by
Carinci Hm Irt and Carinci
Bought by
Carinci Joseph and Carinci Lindsay
Current Estimated Value
Home Financials for this Owner
Home Financials are based on the most recent Mortgage that was taken out on this home.
Original Mortgage
$300,000
Outstanding Balance
$297,641
Interest Rate
6.79%
Mortgage Type
Purchase Money Mortgage
Estimated Equity
$362,373
Create a Home Valuation Report for This Property
The Home Valuation Report is an in-depth analysis detailing your home's value as well as a comparison with similar homes in the area
Home Values in the Area
Average Home Value in this Area
Purchase History
| Date | Buyer | Sale Price | Title Company |
|---|---|---|---|
| Carinci Joseph | $600,000 | None Available | |
| Carinci Joseph | $600,000 | None Available |
Source: Public Records
Mortgage History
| Date | Status | Borrower | Loan Amount |
|---|---|---|---|
| Open | Carinci Joseph | $300,000 | |
| Closed | Carinci Joseph | $300,000 |
Source: Public Records
Tax History Compared to Growth
Tax History
| Year | Tax Paid | Tax Assessment Tax Assessment Total Assessment is a certain percentage of the fair market value that is determined by local assessors to be the total taxable value of land and additions on the property. | Land | Improvement |
|---|---|---|---|---|
| 2025 | $7,090 | $614,900 | $311,700 | $303,200 |
| 2024 | $6,734 | $597,500 | $297,000 | $300,500 |
| 2023 | $6,135 | $551,200 | $270,300 | $280,900 |
| 2022 | $6,215 | $518,800 | $246,100 | $272,700 |
| 2021 | $6,177 | $508,800 | $246,100 | $262,700 |
| 2020 | $6,094 | $490,300 | $232,300 | $258,000 |
| 2019 | $5,552 | $442,400 | $215,300 | $227,100 |
| 2018 | $5,387 | $403,800 | $196,100 | $207,700 |
| 2017 | $5,156 | $363,900 | $186,900 | $177,000 |
| 2016 | $4,815 | $335,300 | $170,200 | $165,100 |
| 2015 | $4,666 | $319,600 | $160,700 | $158,900 |
| 2014 | $4,471 | $300,900 | $160,700 | $140,200 |
Source: Public Records
Map
Nearby Homes
- 16 Dartmouth St Unit 16
- 32 Sumner St
- 51 Sumner St
- 33 Elm St
- 19 Keyes St
- 166 Phipps St
- 81-85 Water St
- 25 5th Ave
- 2 Cliveden St Unit 601E
- 2 Cliveden St Unit 405E
- 187 Washington St
- 313 Washington St
- 18 Cliveden St Unit 406W
- 18 Cliveden St Unit 201W
- 83 Madison Ave
- 50 N Payne St Unit 1
- 50 N Payne St Unit 3
- 200 Falls Blvd Unit B305
- 200 Falls Blvd Unit C308
- 161 Sumner St Unit 2
- 13 Martensen St
- 25 Martensen St
- 9 Martensen St
- 16 Martensen St
- 16 Martensen St Unit 2
- 22 Martensen St
- 26 Martensen St
- 35 Scammell St
- 51 Scammell St
- 55 Scammell St Unit 2
- 55 Scammell St
- 150 Quincy Ave Unit 4A
- 150 Quincy Ave Unit 3A
- 150 Quincy Ave Unit 2C
- 150 Quincy Ave Unit 2A
- 150 Quincy Ave Unit 1A
- 150 Quincy Ave Unit 1B
- 150 Quincy Ave
- 150 Quincy Ave Unit 1C
- 150 Quincy Ave Unit 3B