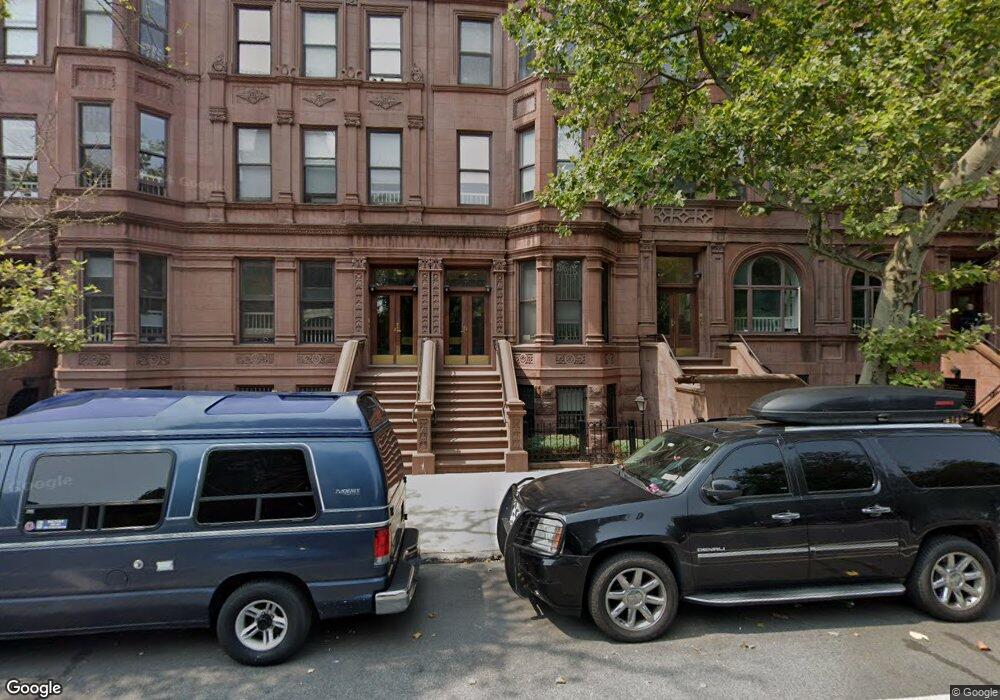
19 Mount Morris Park W Unit 5D New York, NY 10027
Central Harlem NeighborhoodEstimated Value: $846,836 - $1,320,000
--
Bed
--
Bath
1,319
Sq Ft
$839/Sq Ft
Est. Value
About This Home
This home is located at 19 Mount Morris Park W Unit 5D, New York, NY 10027 and is currently estimated at $1,106,709, approximately $839 per square foot. 19 Mount Morris Park W Unit 5D is a home located in New York County with nearby schools including Ps 242 The Young Diplomats Magnet School, Future Leaders Institute Charter School, and Neighborhood Charter School of Harlem.
Ownership History
Date
Name
Owned For
Owner Type
Purchase Details
Closed on
Jun 30, 2008
Sold by
Williams Clyde E
Bought by
Debock Julien
Current Estimated Value
Purchase Details
Closed on
Mar 6, 2006
Sold by
Sutphen Mona K and Williams Clyde E
Bought by
Williams Clyde E
Purchase Details
Closed on
Nov 3, 2003
Sold by
Hcdc Housing Development Fund Company In and % Mount Morris Preservation Llc
Bought by
Sutphen Mona K and Williams Clyde E
Home Financials for this Owner
Home Financials are based on the most recent Mortgage that was taken out on this home.
Original Mortgage
$291,600
Interest Rate
6.03%
Mortgage Type
Purchase Money Mortgage
Create a Home Valuation Report for This Property
The Home Valuation Report is an in-depth analysis detailing your home's value as well as a comparison with similar homes in the area
Home Values in the Area
Average Home Value in this Area
Purchase History
| Date | Buyer | Sale Price | Title Company |
|---|---|---|---|
| Debock Julien | $931,000 | -- | |
| Debock Julien | $931,000 | -- | |
| Williams Clyde E | -- | -- | |
| Williams Jr Clyde E | -- | -- | |
| Sutphen Mona K | $324,000 | -- | |
| Sutphen Mona K | $324,000 | -- |
Source: Public Records
Mortgage History
| Date | Status | Borrower | Loan Amount |
|---|---|---|---|
| Previous Owner | Sutphen Mona K | $291,600 | |
| Closed | Williams Jr Clyde E | $0 |
Source: Public Records
Tax History Compared to Growth
Tax History
| Year | Tax Paid | Tax Assessment Tax Assessment Total Assessment is a certain percentage of the fair market value that is determined by local assessors to be the total taxable value of land and additions on the property. | Land | Improvement |
|---|---|---|---|---|
| 2025 | $7,031 | $59,671 | $3,636 | $56,035 |
| 2024 | $7,031 | $58,556 | $3,636 | $54,920 |
| 2023 | $3,472 | $58,793 | $3,636 | $55,157 |
| 2022 | $3,139 | $54,664 | $3,636 | $51,028 |
| 2021 | $6,273 | $53,600 | $3,636 | $49,964 |
| 2020 | $4,240 | $62,010 | $3,636 | $58,374 |
| 2019 | $2,538 | $61,641 | $3,636 | $58,005 |
| 2018 | $3,080 | $54,162 | $3,637 | $50,525 |
| 2017 | $1,966 | $45,470 | $3,637 | $41,833 |
| 2016 | $992 | $41,168 | $3,636 | $37,532 |
| 2015 | -- | $33,437 | $3,636 | $29,801 |
| 2014 | -- | $31,491 | $3,636 | $27,855 |
Source: Public Records
Map
Nearby Homes
- 42 W 120th St Unit 3-C
- 53 W 119th St Unit 1
- 29 W 119th St Unit 3
- 22 W 120th St
- 5 W 120th St Unit 1
- 32 W 119th St
- 9 Mount Morris Park W Unit A
- 6 W 121st St
- 81 W 119th St
- 14 W 121st St
- 1485 5th Ave Unit 11B
- 1485 5th Ave Unit 1819H
- 1485 5th Ave Unit 9G
- 1485 5th Ave Unit 23A
- 1485 5th Ave Unit 13A
- 1485 5th Ave Unit 19C
- 1485 5th Ave Unit 13D
- 10 W 122nd St
- 100 W 121st St Unit 32
- 240 Lenox Ave
- 1 Mount Morris Park W Unit 4B
- 19 Mount Morris Park W Unit 2C
- 19 Mount Morris Park W Unit 9D
- 19 Mount Morris Park W Unit 8D
- 19 Mount Morris Park W Unit 7D
- 19 Mount Morris Park W Unit 6D
- 19 Mount Morris Park W Unit 3D
- 1 Mount Morris Park W Unit 1D9
- 19 Mount Morris Park W Unit 9C
- 19 Mount Morris Park W Unit 7C
- 19 Mount Morris Park W Unit 6C
- 19 Mount Morris Park W Unit 5C
- 19 Mount Morris Park W Unit 4C
- 19 Mount Morris Park W Unit 3C
- 1 Mount Morris Park W Unit 1C9
- 19 Mount Morris Park W Unit 9B
- 19 Mount Morris Park W Unit 8B
- 19 Mount Morris Park W Unit 7B
- 19 Mount Morris Park W Unit 6B
- 19 Mount Morris Park W Unit 5B