19 Myrtle Ave Cranston, RI 02910
Eden Park NeighborhoodEstimated Value: $412,944 - $508,000
3
Beds
1
Bath
1,486
Sq Ft
$301/Sq Ft
Est. Value
About This Home
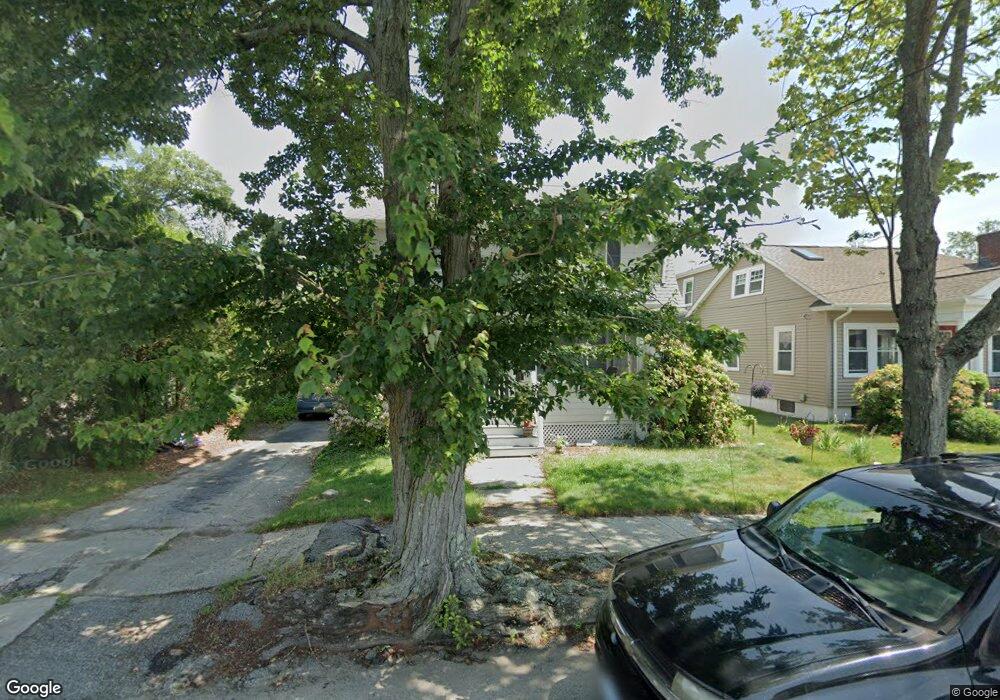
This home is located at 19 Myrtle Ave, Cranston, RI 02910 and is currently estimated at $446,986, approximately $300 per square foot. 19 Myrtle Ave is a home located in Providence County with nearby schools including Park View Middle School, Cranston High School East, and Cadence Academy Preschool - Cranston.
Ownership History
Date
Name
Owned For
Owner Type
Purchase Details
Closed on
Jul 21, 2014
Sold by
Wright Daniel E and Wright Natalie L
Bought by
Wright Natalie L
Current Estimated Value
Purchase Details
Closed on
Sep 24, 1993
Sold by
Kurowski David A and Kurowski Patricia
Bought by
Wright Daniel E and Wright Natalie
Home Financials for this Owner
Home Financials are based on the most recent Mortgage that was taken out on this home.
Original Mortgage
$84,000
Interest Rate
7.1%
Create a Home Valuation Report for This Property
The Home Valuation Report is an in-depth analysis detailing your home's value as well as a comparison with similar homes in the area
Home Values in the Area
Average Home Value in this Area
Purchase History
| Date | Buyer | Sale Price | Title Company |
|---|---|---|---|
| Wright Natalie L | -- | -- | |
| Wright Daniel E | $114,000 | -- |
Source: Public Records
Mortgage History
| Date | Status | Borrower | Loan Amount |
|---|---|---|---|
| Previous Owner | Wright Daniel E | $95,000 | |
| Previous Owner | Wright Daniel E | $84,000 |
Source: Public Records
Tax History
| Year | Tax Paid | Tax Assessment Tax Assessment Total Assessment is a certain percentage of the fair market value that is determined by local assessors to be the total taxable value of land and additions on the property. | Land | Improvement |
|---|---|---|---|---|
| 2025 | $4,623 | $333,100 | $106,900 | $226,200 |
| 2024 | $4,533 | $333,100 | $106,900 | $226,200 |
| 2023 | $4,413 | $233,500 | $70,400 | $163,100 |
| 2022 | $4,322 | $233,500 | $70,400 | $163,100 |
| 2021 | $4,203 | $233,500 | $70,400 | $163,100 |
| 2020 | $4,129 | $198,800 | $67,000 | $131,800 |
| 2019 | $4,129 | $198,800 | $67,000 | $131,800 |
| 2018 | $4,034 | $198,800 | $67,000 | $131,800 |
| 2017 | $4,175 | $182,000 | $60,300 | $121,700 |
| 2016 | $4,086 | $182,000 | $60,300 | $121,700 |
| 2015 | $4,086 | $182,000 | $60,300 | $121,700 |
| 2014 | $3,928 | $172,000 | $60,300 | $111,700 |
Source: Public Records
Map
Nearby Homes
Your Personal Tour Guide
Ask me questions while you tour the home.