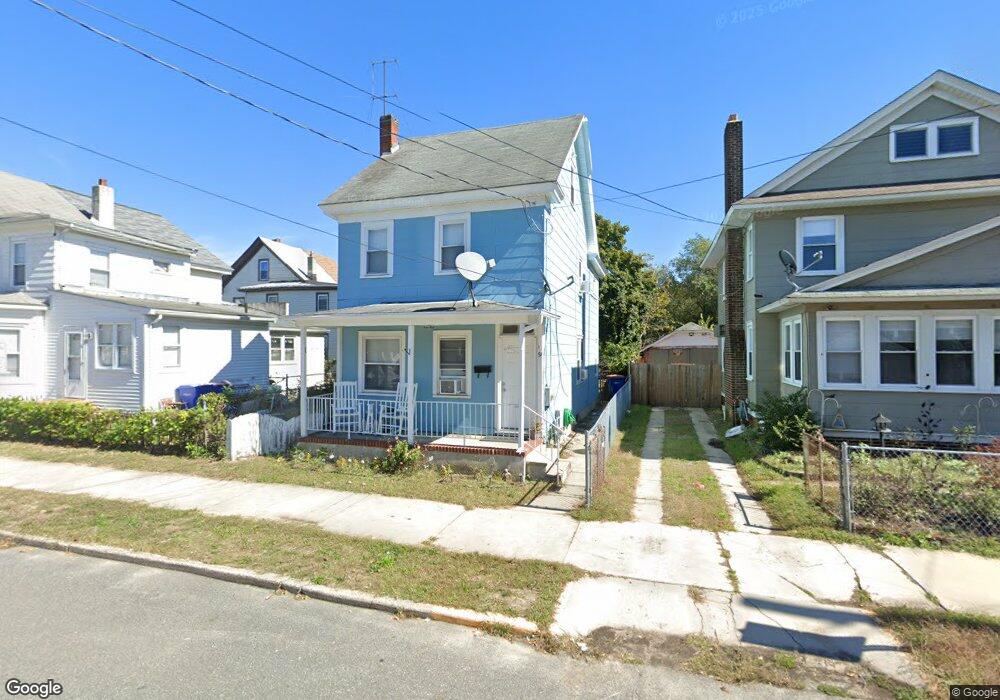
19 N 4th St Millville, NJ 08332
Estimated Value: $148,000 - $199,000
Studio
--
Bath
1,367
Sq Ft
$123/Sq Ft
Est. Value
About This Home
This home is located at 19 N 4th St, Millville, NJ 08332 and is currently estimated at $168,273, approximately $123 per square foot. 19 N 4th St is a home located in Cumberland County with nearby schools including Silver Run Elementary School, Lakeside Middle School, and Memorial High School.
Ownership History
Date
Name
Owned For
Owner Type
Purchase Details
Closed on
Oct 5, 2007
Sold by
Szabo Vance J and Levitt Marc E
Bought by
Levitt Marc E
Current Estimated Value
Purchase Details
Closed on
Jun 10, 2005
Sold by
Showell Anthony
Bought by
Szabo Vance J and Levitt Marc E
Home Financials for this Owner
Home Financials are based on the most recent Mortgage that was taken out on this home.
Original Mortgage
$58,950
Interest Rate
5.82%
Create a Home Valuation Report for This Property
The Home Valuation Report is an in-depth analysis detailing your home's value as well as a comparison with similar homes in the area
Home Values in the Area
Average Home Value in this Area
Purchase History
| Date | Buyer | Sale Price | Title Company |
|---|---|---|---|
| Levitt Marc E | $79,000 | -- | |
| Szabo Vance J | $65,100 | -- |
Source: Public Records
Mortgage History
| Date | Status | Borrower | Loan Amount |
|---|---|---|---|
| Previous Owner | Szabo Vance J | $58,950 |
Source: Public Records
Tax History
| Year | Tax Paid | Tax Assessment Tax Assessment Total Assessment is a certain percentage of the fair market value that is determined by local assessors to be the total taxable value of land and additions on the property. | Land | Improvement |
|---|---|---|---|---|
| 2025 | $2,653 | $67,600 | $13,000 | $54,600 |
| 2024 | $2,631 | $67,600 | $13,000 | $54,600 |
| 2023 | $2,631 | $67,600 | $13,000 | $54,600 |
| 2022 | $2,563 | $67,600 | $13,000 | $54,600 |
| 2021 | $2,480 | $67,600 | $13,000 | $54,600 |
| 2020 | $2,438 | $67,600 | $13,000 | $54,600 |
| 2019 | $2,325 | $67,600 | $13,000 | $54,600 |
| 2018 | $2,277 | $67,600 | $13,000 | $54,600 |
| 2017 | $2,256 | $67,600 | $13,000 | $54,600 |
| 2016 | $2,228 | $67,600 | $13,000 | $54,600 |
| 2015 | $2,178 | $67,600 | $13,000 | $54,600 |
| 2014 | $2,182 | $67,600 | $13,000 | $54,600 |
Source: Public Records
Map
Nearby Homes
Your Personal Tour Guide
Ask me questions while you tour the home.