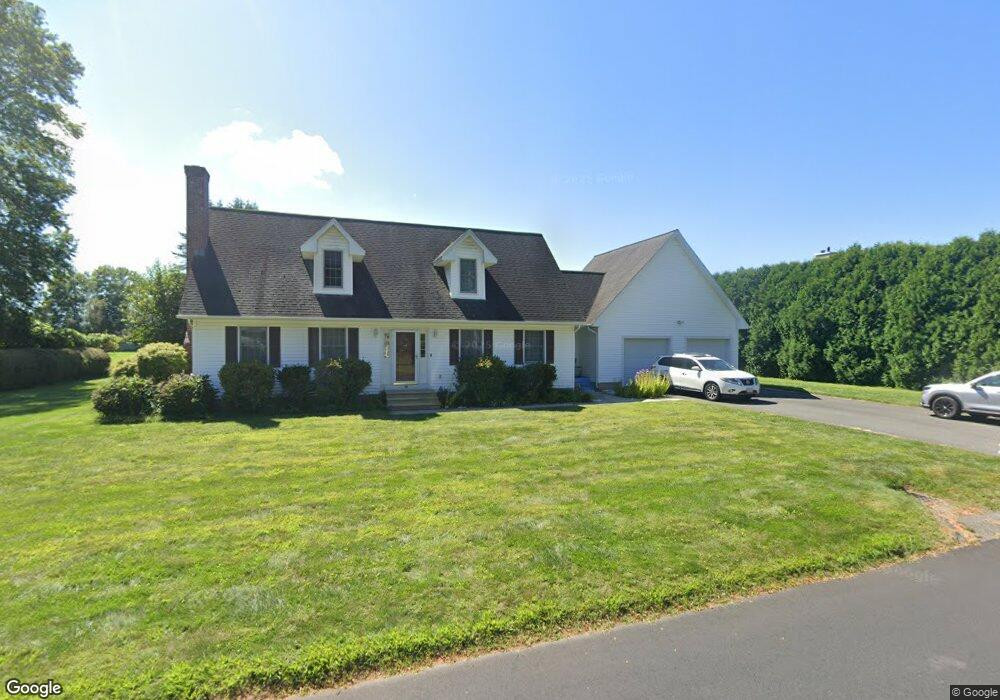
19 Newton Ln Hadley, MA 01035
Estimated Value: $458,000 - $648,000
3
Beds
3
Baths
2,300
Sq Ft
$245/Sq Ft
Est. Value
About This Home
This home is located at 19 Newton Ln, Hadley, MA 01035 and is currently estimated at $563,236, approximately $244 per square foot. 19 Newton Ln is a home located in Hampshire County with nearby schools including Hadley Elementary School, Hopkins Academy, and Pioneer Valley Chinese Immersion Charter School.
Ownership History
Date
Name
Owned For
Owner Type
Purchase Details
Closed on
May 1, 2007
Sold by
Jekanowski James J and Jekanowski Kim A
Bought by
Lee Sang Soo and Kim So Youn
Current Estimated Value
Home Financials for this Owner
Home Financials are based on the most recent Mortgage that was taken out on this home.
Original Mortgage
$288,000
Outstanding Balance
$175,277
Interest Rate
6.18%
Mortgage Type
Purchase Money Mortgage
Estimated Equity
$387,959
Create a Home Valuation Report for This Property
The Home Valuation Report is an in-depth analysis detailing your home's value as well as a comparison with similar homes in the area
Home Values in the Area
Average Home Value in this Area
Purchase History
| Date | Buyer | Sale Price | Title Company |
|---|---|---|---|
| Lee Sang Soo | $360,000 | -- |
Source: Public Records
Mortgage History
| Date | Status | Borrower | Loan Amount |
|---|---|---|---|
| Open | Lee Sang Soo | $288,000 |
Source: Public Records
Tax History Compared to Growth
Tax History
| Year | Tax Paid | Tax Assessment Tax Assessment Total Assessment is a certain percentage of the fair market value that is determined by local assessors to be the total taxable value of land and additions on the property. | Land | Improvement |
|---|---|---|---|---|
| 2025 | $5,145 | $442,400 | $120,200 | $322,200 |
| 2024 | $4,942 | $433,900 | $120,200 | $313,700 |
| 2023 | $4,736 | $410,400 | $120,200 | $290,200 |
| 2022 | $4,382 | $359,800 | $120,200 | $239,600 |
| 2021 | $4,261 | $355,100 | $120,200 | $234,900 |
| 2020 | $4,323 | $338,300 | $120,200 | $218,100 |
| 2019 | $4,181 | $338,300 | $120,200 | $218,100 |
| 2018 | $4,090 | $338,300 | $120,200 | $218,100 |
| 2017 | $3,855 | $333,200 | $120,200 | $213,000 |
| 2016 | $3,715 | $333,200 | $120,200 | $213,000 |
| 2015 | $3,619 | $333,200 | $120,200 | $213,000 |
| 2014 | $3,545 | $333,200 | $120,200 | $213,000 |
Source: Public Records
Map
Nearby Homes