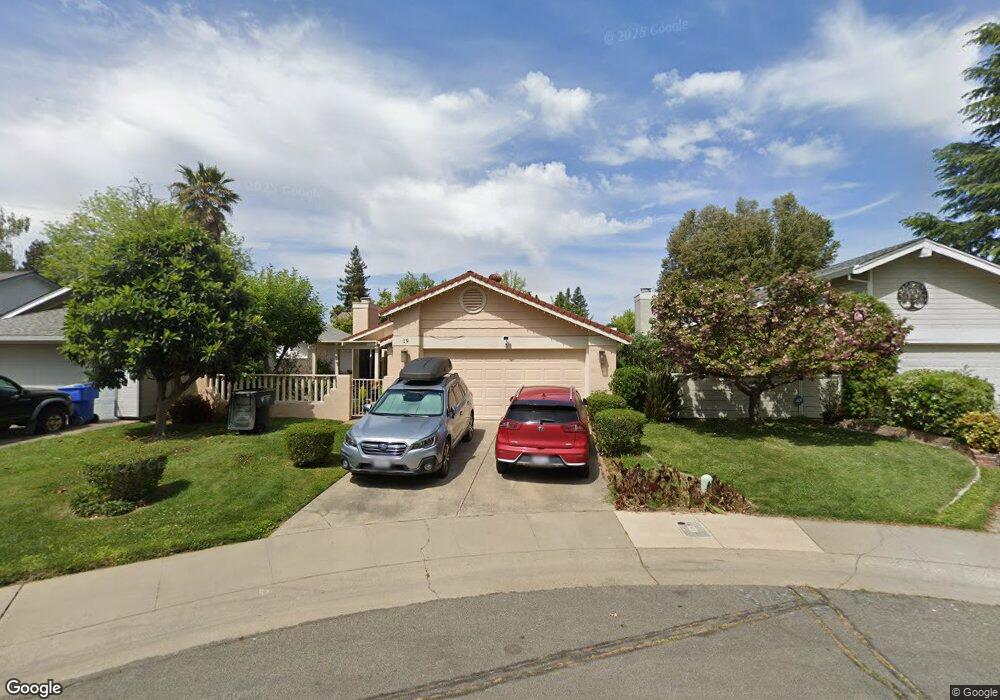
19 Oceanfront Ct Sacramento, CA 95831
Pocket-Greenhaven NeighborhoodEstimated Value: $356,000 - $568,000
3
Beds
2
Baths
1,195
Sq Ft
$403/Sq Ft
Est. Value
About This Home
This home is located at 19 Oceanfront Ct, Sacramento, CA 95831 and is currently estimated at $481,953, approximately $403 per square foot. 19 Oceanfront Ct is a home located in Sacramento County with nearby schools including Martin Luther King, Jr School, Sam Brannan Middle School, and John F. Kennedy High School.
Ownership History
Date
Name
Owned For
Owner Type
Purchase Details
Closed on
Jul 22, 2022
Sold by
Roxanne Steele
Bought by
Ronald Steele And Roxanne Steele Living Trust
Current Estimated Value
Purchase Details
Closed on
Oct 2, 2013
Sold by
Alvarez Grimaldina A and Steele Roxanne
Bought by
Steele Roxanne
Purchase Details
Closed on
May 3, 2006
Sold by
Steele Roxanne
Bought by
Alvarez Grimaldina A and Steele Roxanne
Purchase Details
Closed on
Jul 16, 2004
Sold by
Alvarez Grimaldina A
Bought by
Steele Roxame
Purchase Details
Closed on
Oct 6, 1997
Sold by
Steele Roxanne
Bought by
Alvarez Grimaldina A and Steele Roxanne
Purchase Details
Closed on
May 6, 1996
Sold by
Alvarez Grimaldina
Bought by
Vila Roberto Carlos
Purchase Details
Closed on
Jul 12, 1995
Sold by
Alvarez Grimaldina A
Bought by
Steele Roxanne
Create a Home Valuation Report for This Property
The Home Valuation Report is an in-depth analysis detailing your home's value as well as a comparison with similar homes in the area
Home Values in the Area
Average Home Value in this Area
Purchase History
| Date | Buyer | Sale Price | Title Company |
|---|---|---|---|
| Ronald Steele And Roxanne Steele Living Trust | -- | Law Office Of Michael Johnson | |
| Steele Roxanne | -- | None Available | |
| Alvarez Grimaldina A | -- | None Available | |
| Steele Roxame | -- | -- | |
| Alvarez Grimaldina A | -- | -- | |
| Vila Roberto Carlos | -- | -- | |
| Steele Roxanne | -- | -- |
Source: Public Records
Tax History Compared to Growth
Tax History
| Year | Tax Paid | Tax Assessment Tax Assessment Total Assessment is a certain percentage of the fair market value that is determined by local assessors to be the total taxable value of land and additions on the property. | Land | Improvement |
|---|---|---|---|---|
| 2025 | $3,748 | $301,841 | $126,240 | $175,601 |
| 2024 | $3,748 | $295,923 | $123,765 | $172,158 |
| 2023 | $3,654 | $290,122 | $121,339 | $168,783 |
| 2022 | $3,526 | $284,434 | $118,960 | $165,474 |
| 2021 | $3,355 | $278,858 | $116,628 | $162,230 |
| 2020 | $3,375 | $276,000 | $115,433 | $160,567 |
| 2019 | $3,303 | $270,589 | $113,170 | $157,419 |
| 2018 | $3,216 | $265,284 | $110,951 | $154,333 |
| 2017 | $3,167 | $260,083 | $108,776 | $151,307 |
| 2016 | $3,096 | $254,985 | $106,644 | $148,341 |
| 2015 | $3,040 | $251,156 | $105,043 | $146,113 |
| 2014 | $2,967 | $246,237 | $102,986 | $143,251 |
Source: Public Records
Map
Nearby Homes
- 462 de Mar Dr
- 4 Marina Blue Ct
- 7262 Harbor Light Way
- 4 Bingham Cir
- 26 Marina Grande Ct
- 7716 George River Ln
- 4 Park River Oak Ct
- 10 Fleet Ct
- 487 Twin River Way
- 763 La Contenta Way
- 7922 Collins Isle Ln
- 6980 Riverside Blvd
- 0 Riverside Blvd
- 14 Westlite Ct
- 506 Roundtree Ct
- 9 Sandhill Ct
- 1 Sandpointe Ct
- 857 Lake Front Dr
- 14 Morningsun Ct
- 52415-52979 S River Rd
- 15 Oceanfront Ct
- 23 Oceanfront Ct
- 9 Oceanfront Ct
- 22 Waterfront Ct
- 26 Waterfront Ct
- 18 Waterfront Ct
- 5 Oceanfront Ct
- 14 Waterfront Ct
- 14 Oceanfront Ct
- 18 Oceanfront Ct
- 10 Waterfront Ct
- 22 Oceanfront Ct
- 10 Oceanfront Ct
- 7429 Salton Sea Way
- 7433 Salton Sea Way
- 6 Waterfront Ct
- 6 Oceanfront Ct
- 7441 Salton Sea Way
- 2 Waterfront Ct
- 7445 Salton Sea Way