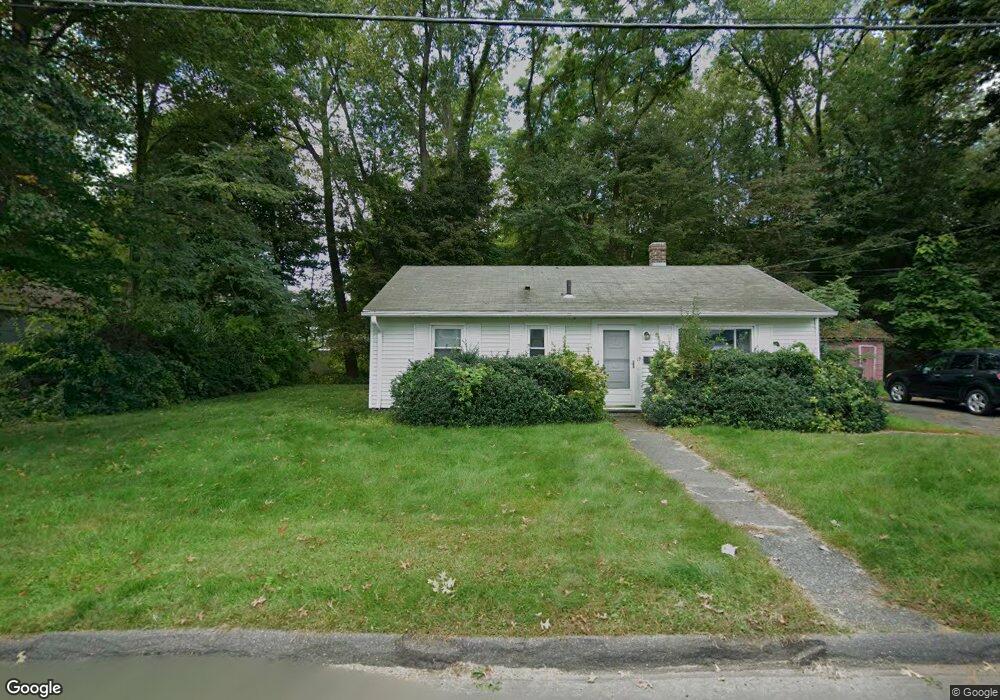
19 Ormond Dr Florence, MA 01062
Florence NeighborhoodEstimated Value: $320,845 - $700,000
3
Beds
1
Bath
925
Sq Ft
$466/Sq Ft
Est. Value
About This Home
This home is located at 19 Ormond Dr, Florence, MA 01062 and is currently estimated at $431,461, approximately $466 per square foot. 19 Ormond Dr is a home located in Hampshire County with nearby schools including Northampton High School, The Montessori School of Northampton, and Lander Grinspoon Academy.
Ownership History
Date
Name
Owned For
Owner Type
Purchase Details
Closed on
Jan 2, 2019
Sold by
Amberman Edward L Est
Bought by
58 Market Street Llc
Current Estimated Value
Purchase Details
Closed on
Jul 29, 2004
Sold by
Est Amberman Eleanor R and Amberman Richard W
Bought by
Amberman Edward
Create a Home Valuation Report for This Property
The Home Valuation Report is an in-depth analysis detailing your home's value as well as a comparison with similar homes in the area
Home Values in the Area
Average Home Value in this Area
Purchase History
| Date | Buyer | Sale Price | Title Company |
|---|---|---|---|
| 58 Market Street Llc | $175,000 | None Available | |
| Amberman Edward | -- | -- |
Source: Public Records
Mortgage History
| Date | Status | Borrower | Loan Amount |
|---|---|---|---|
| Previous Owner | Amberman Edward | $235,500 | |
| Previous Owner | Amberman Edward | $4,594 |
Source: Public Records
Tax History
| Year | Tax Paid | Tax Assessment Tax Assessment Total Assessment is a certain percentage of the fair market value that is determined by local assessors to be the total taxable value of land and additions on the property. | Land | Improvement |
|---|---|---|---|---|
| 2025 | $3,626 | $260,300 | $112,100 | $148,200 |
| 2024 | $3,594 | $236,600 | $112,100 | $124,500 |
| 2023 | $3,852 | $243,200 | $101,900 | $141,300 |
| 2022 | $3,725 | $208,200 | $101,900 | $106,300 |
| 2021 | $2,963 | $170,600 | $97,000 | $73,600 |
| 2020 | $2,866 | $170,600 | $97,000 | $73,600 |
| 2019 | $2,531 | $145,700 | $97,000 | $48,700 |
| 2018 | $2,571 | $151,300 | $97,000 | $54,300 |
| 2017 | $2,525 | $151,300 | $97,000 | $54,300 |
| 2016 | $2,445 | $151,300 | $97,000 | $54,300 |
| 2015 | $2,226 | $140,900 | $95,100 | $45,800 |
| 2014 | $2,168 | $140,900 | $95,100 | $45,800 |
Source: Public Records
Map
Nearby Homes
- 63 Riverside Dr
- 61 Woodlawn Ave
- 61 Harrison Ave
- 218 Elm St
- 0 Terrace Ln
- 23 Ford Crossing
- 61 Crescent St Unit 8
- 61 Crescent St Unit 7
- 37 Landy Ave
- 575 Bridge Rd Unit 12-7
- 575 Bridge Rd Unit 10-5
- 37 Finn St
- 13A Finn St
- 289 Hatfield St
- 76 Maple St
- 43 Center St Unit K
- 67 Park St Unit A
- 231 Main St Unit 3R
- 44 Sheffield Ln
- 244 Main St
Your Personal Tour Guide
Ask me questions while you tour the home.