19 Otis St Mansfield, MA 02048
Estimated Value: $685,614 - $851,000
5
Beds
2
Baths
2,393
Sq Ft
$320/Sq Ft
Est. Value
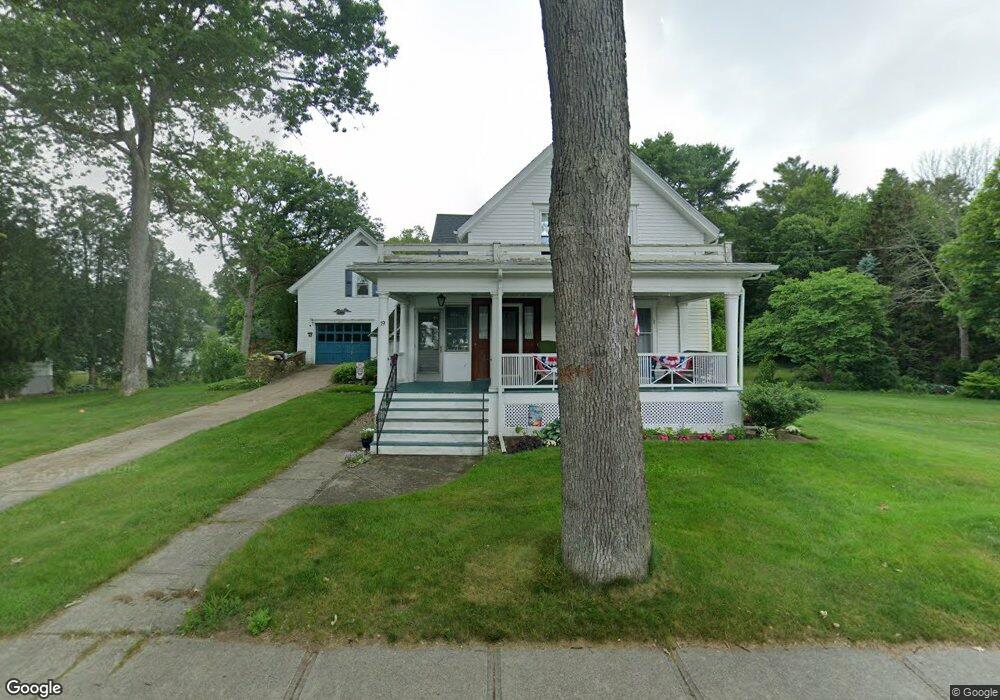
About This Home
This home is located at 19 Otis St, Mansfield, MA 02048 and is currently estimated at $765,404, approximately $319 per square foot. 19 Otis St is a home located in Bristol County with nearby schools including Everett W. Robinson Elementary School, Jordan/Jackson Elementary School, and Harold L. Qualters Middle School.
Ownership History
Date
Name
Owned For
Owner Type
Purchase Details
Closed on
Dec 19, 2012
Sold by
Stephanie M Motyl Ret
Bought by
Motyl Stephanie J
Current Estimated Value
Create a Home Valuation Report for This Property
The Home Valuation Report is an in-depth analysis detailing your home's value as well as a comparison with similar homes in the area
Home Values in the Area
Average Home Value in this Area
Purchase History
| Date | Buyer | Sale Price | Title Company |
|---|---|---|---|
| Motyl Stephanie J | -- | -- |
Source: Public Records
Tax History
| Year | Tax Paid | Tax Assessment Tax Assessment Total Assessment is a certain percentage of the fair market value that is determined by local assessors to be the total taxable value of land and additions on the property. | Land | Improvement |
|---|---|---|---|---|
| 2025 | $7,969 | $605,100 | $255,700 | $349,400 |
| 2024 | $6,773 | $501,700 | $255,700 | $246,000 |
| 2023 | $6,190 | $439,300 | $255,700 | $183,600 |
| 2022 | $6,009 | $396,100 | $237,000 | $159,100 |
| 2021 | $6,619 | $430,900 | $207,200 | $223,700 |
| 2020 | $5,955 | $387,700 | $197,400 | $190,300 |
| 2019 | $6,251 | $410,700 | $164,700 | $246,000 |
| 2018 | $5,816 | $425,600 | $157,300 | $268,300 |
| 2017 | $5,590 | $372,200 | $153,000 | $219,200 |
| 2016 | $5,139 | $333,500 | $145,500 | $188,000 |
| 2015 | $5,169 | $333,500 | $145,500 | $188,000 |
Source: Public Records
Map
Nearby Homes
- 14 Claire Ave
- 44 Surrey Dr
- 85 Jewell St
- 2 Oak St Unit 2B
- 150 Gilbert St
- 451R Gilbert St
- 128 Tremont St
- 24 Maverick Dr
- 250 Mansfield Ave Unit 11
- 71 Richardson Ave
- 1769 West St
- 49 Pheasant Hill Rd
- 343 Godfrey Dr
- 143 Oak St Unit 10
- 101 Godfrey Dr Unit 101
- 10 Walter St
- 17 Childs Ln
- 25 Shepherd St
- 157 Mansfield Ave Unit 27
- 157 Mansfield Ave Unit 14
Your Personal Tour Guide
Ask me questions while you tour the home.