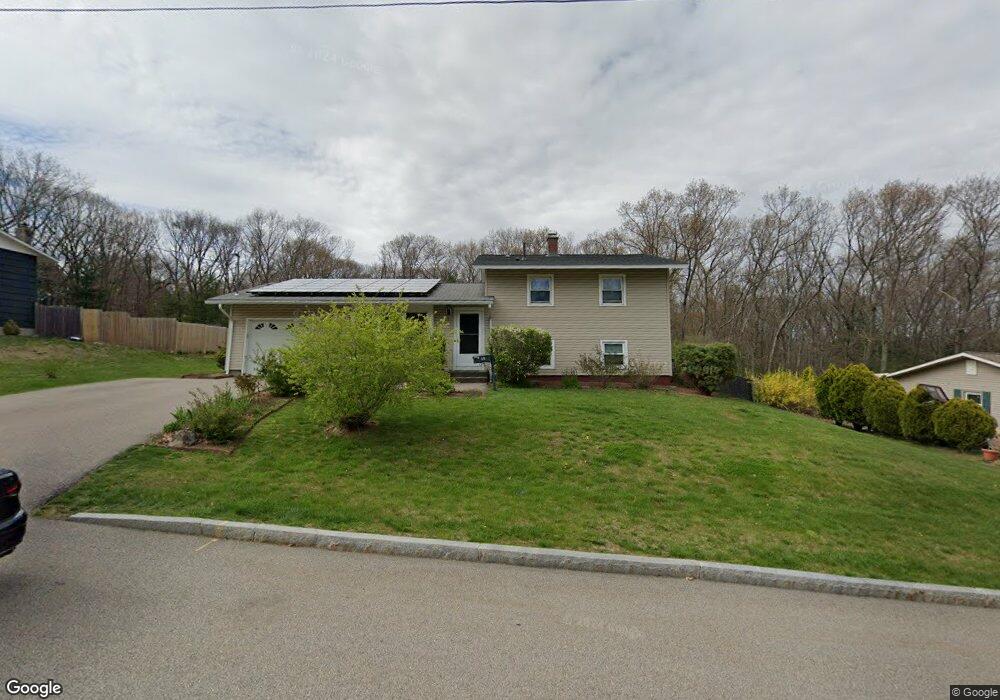
19 Pamela Rd Framingham, MA 01701
Nobscot NeighborhoodEstimated Value: $665,000 - $742,000
4
Beds
3
Baths
1,687
Sq Ft
$421/Sq Ft
Est. Value
About This Home
This home is located at 19 Pamela Rd, Framingham, MA 01701 and is currently estimated at $711,019, approximately $421 per square foot. 19 Pamela Rd is a home located in Middlesex County with nearby schools including Framingham High School, MetroWest Jewish Day School, and Sudbury Valley School.
Ownership History
Date
Name
Owned For
Owner Type
Purchase Details
Closed on
Jul 28, 1999
Sold by
Bernhoft Donald C and Bernhoft Tina M
Bought by
Lohnes Scott F and Lohnes Juli M
Current Estimated Value
Purchase Details
Closed on
Mar 2, 1998
Sold by
Feldman Michel E and Feldman Deborah H
Bought by
Bernhoft Donald C and Bernhoft Tina M
Purchase Details
Closed on
Jun 29, 1989
Sold by
Rothschild Bernard
Bought by
Feldman Michael E
Create a Home Valuation Report for This Property
The Home Valuation Report is an in-depth analysis detailing your home's value as well as a comparison with similar homes in the area
Home Values in the Area
Average Home Value in this Area
Purchase History
| Date | Buyer | Sale Price | Title Company |
|---|---|---|---|
| Lohnes Scott F | $240,100 | -- | |
| Bernhoft Donald C | $214,450 | -- | |
| Bernhoft Donald C | $214,450 | -- | |
| Feldman Michael E | $177,000 | -- | |
| Feldman Michael E | $177,000 | -- |
Source: Public Records
Mortgage History
| Date | Status | Borrower | Loan Amount |
|---|---|---|---|
| Open | Feldman Michael E | $155,000 | |
| Closed | Feldman Michael E | $12,000 |
Source: Public Records
Tax History
| Year | Tax Paid | Tax Assessment Tax Assessment Total Assessment is a certain percentage of the fair market value that is determined by local assessors to be the total taxable value of land and additions on the property. | Land | Improvement |
|---|---|---|---|---|
| 2025 | $7,920 | $663,300 | $271,300 | $392,000 |
| 2024 | $7,530 | $604,300 | $242,300 | $362,000 |
| 2023 | $7,056 | $539,000 | $216,200 | $322,800 |
| 2022 | $6,676 | $485,900 | $196,200 | $289,700 |
| 2021 | $6,523 | $464,300 | $188,600 | $275,700 |
| 2020 | $6,778 | $452,500 | $171,400 | $281,100 |
| 2019 | $6,660 | $433,000 | $171,400 | $261,600 |
| 2018 | $6,526 | $399,900 | $165,000 | $234,900 |
| 2017 | $6,360 | $380,600 | $160,200 | $220,400 |
| 2016 | $6,519 | $375,100 | $160,200 | $214,900 |
| 2015 | $6,290 | $353,000 | $160,700 | $192,300 |
Source: Public Records
Map
Nearby Homes
Your Personal Tour Guide
Ask me questions while you tour the home.