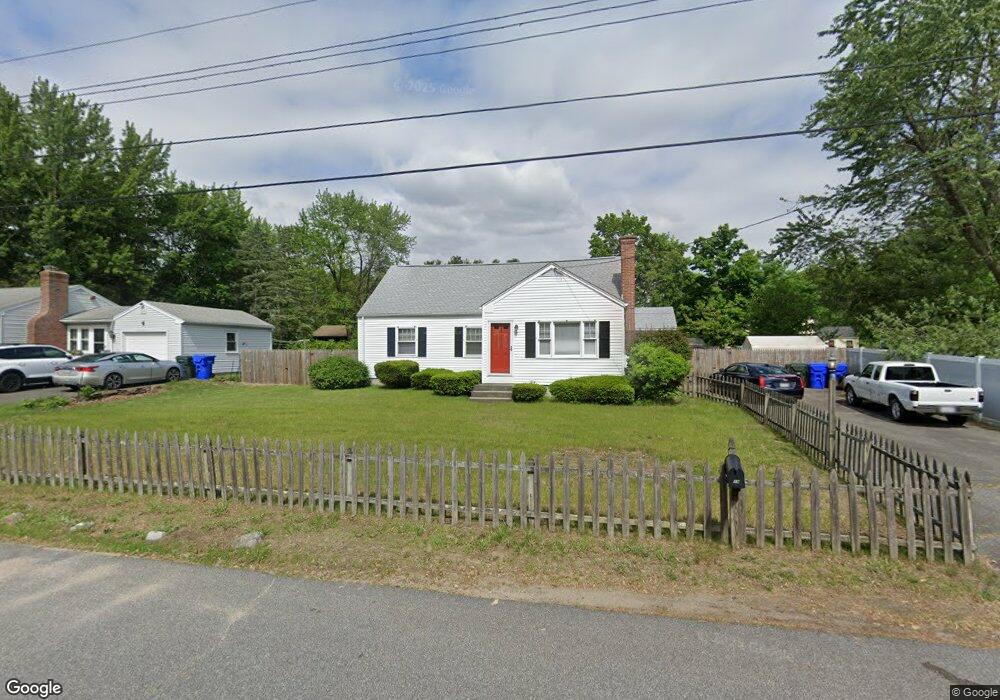
19 Pidgeon Dr Springfield, MA 01119
Sixteen Acres NeighborhoodEstimated Value: $332,624 - $380,000
4
Beds
2
Baths
1,864
Sq Ft
$188/Sq Ft
Est. Value
About This Home
This home is located at 19 Pidgeon Dr, Springfield, MA 01119 and is currently estimated at $351,156, approximately $188 per square foot. 19 Pidgeon Dr is a home located in Hampden County with nearby schools including Mary M. Lynch Elementary School, John J Duggan Middle, and Springfield Central High School.
Ownership History
Date
Name
Owned For
Owner Type
Purchase Details
Closed on
Aug 26, 1991
Sold by
Poole Raymond and Poole Sandra
Bought by
Poole Ernest A and Poole Nancy A
Current Estimated Value
Home Financials for this Owner
Home Financials are based on the most recent Mortgage that was taken out on this home.
Original Mortgage
$60,000
Interest Rate
9.55%
Mortgage Type
Purchase Money Mortgage
Create a Home Valuation Report for This Property
The Home Valuation Report is an in-depth analysis detailing your home's value as well as a comparison with similar homes in the area
Home Values in the Area
Average Home Value in this Area
Purchase History
| Date | Buyer | Sale Price | Title Company |
|---|---|---|---|
| Poole Ernest A | $23,000 | -- |
Source: Public Records
Mortgage History
| Date | Status | Borrower | Loan Amount |
|---|---|---|---|
| Open | Poole Ernest A | $25,000 | |
| Closed | Poole Ernest A | $20,000 | |
| Closed | Poole Ernest A | $72,000 | |
| Closed | Poole Ernest A | $60,000 |
Source: Public Records
Tax History
| Year | Tax Paid | Tax Assessment Tax Assessment Total Assessment is a certain percentage of the fair market value that is determined by local assessors to be the total taxable value of land and additions on the property. | Land | Improvement |
|---|---|---|---|---|
| 2025 | $3,812 | $243,100 | $52,400 | $190,700 |
| 2024 | $3,740 | $232,900 | $52,400 | $180,500 |
| 2023 | $3,572 | $209,500 | $49,900 | $159,600 |
| 2022 | $3,495 | $185,700 | $49,900 | $135,800 |
| 2021 | $3,370 | $178,300 | $45,300 | $133,000 |
| 2020 | $3,310 | $169,500 | $45,300 | $124,200 |
| 2019 | $3,104 | $157,700 | $45,300 | $112,400 |
| 2018 | $3,113 | $158,200 | $45,300 | $112,900 |
| 2017 | $3,112 | $158,300 | $45,200 | $113,100 |
| 2016 | $2,908 | $147,900 | $45,200 | $102,700 |
| 2015 | $2,968 | $150,900 | $45,200 | $105,700 |
Source: Public Records
Map
Nearby Homes
- 381 N Brook Rd
- 63 Granger St
- 854 Grayson Dr
- 186 Bolton St
- 130 Spear Rd
- 195 Almira Rd
- 64 Wilmington St
- 106-108 Breckwood Cir
- 56 Contessa Ln
- 108 Birchland Ave
- 187 Lamont St
- 251 Rosewell St
- Lot 37 Kane St
- 106 Almira Rd
- - Glenwood St
- 70 Shumway St Unit 29
- 39 Wallace St
- 34 Wallace St
- 42 Better Way
- 46 Puritan Cir
Your Personal Tour Guide
Ask me questions while you tour the home.