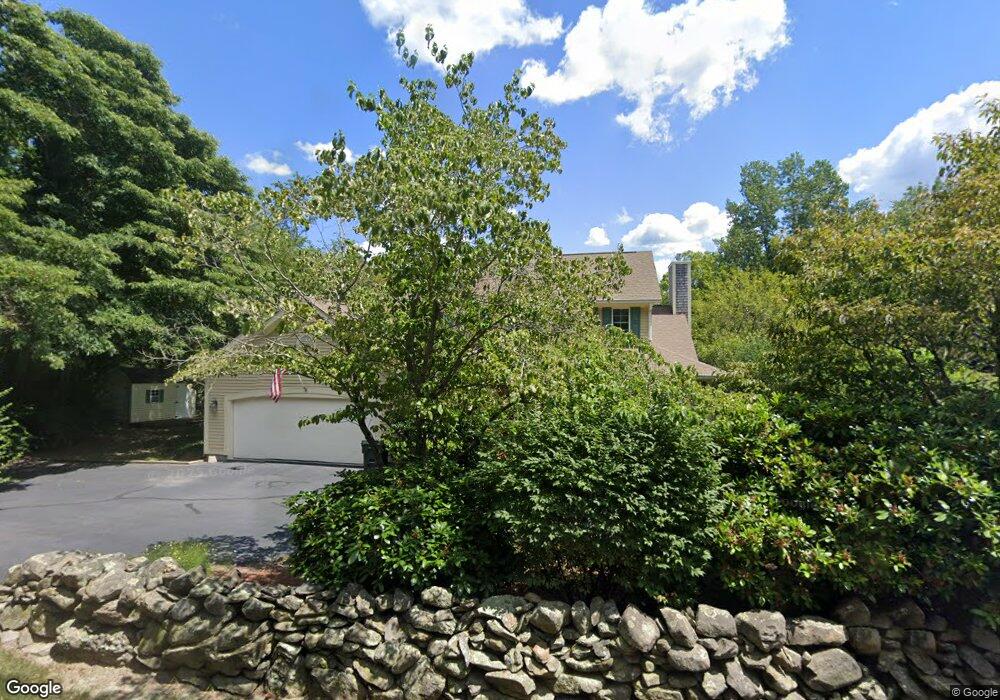
19 Pine St Rehoboth, MA 02769
Estimated Value: $720,000 - $855,000
4
Beds
3
Baths
2,462
Sq Ft
$315/Sq Ft
Est. Value
About This Home
This home is located at 19 Pine St, Rehoboth, MA 02769 and is currently estimated at $775,032, approximately $314 per square foot. 19 Pine St is a home located in Bristol County with nearby schools including Dighton-Rehoboth Regional High School, St Cecilia School, and St Margaret School.
Ownership History
Date
Name
Owned For
Owner Type
Purchase Details
Closed on
Aug 8, 2008
Sold by
Arsenault William R and Arsenault Paulette R
Bought by
Arsenault Tr William R and Arsenault Paulette R
Current Estimated Value
Purchase Details
Closed on
Mar 13, 2007
Sold by
Sluter David A and Sluter Marjorie L
Bought by
Arsenault Paulette R and Arsenault William R
Purchase Details
Closed on
Jan 19, 1996
Sold by
Monarch Bldrs Inc
Bought by
Sluter David A and Sluter Marjorie L
Create a Home Valuation Report for This Property
The Home Valuation Report is an in-depth analysis detailing your home's value as well as a comparison with similar homes in the area
Home Values in the Area
Average Home Value in this Area
Purchase History
| Date | Buyer | Sale Price | Title Company |
|---|---|---|---|
| Arsenault Tr William R | -- | -- | |
| Arsenault Paulette R | $487,000 | -- | |
| Sluter David A | $264,900 | -- |
Source: Public Records
Mortgage History
| Date | Status | Borrower | Loan Amount |
|---|---|---|---|
| Previous Owner | Sluter David A | $166,000 | |
| Previous Owner | Sluter David A | $775,000 | |
| Previous Owner | Sluter David A | $59,000 | |
| Previous Owner | Sluter David A | $63,600 |
Source: Public Records
Tax History
| Year | Tax Paid | Tax Assessment Tax Assessment Total Assessment is a certain percentage of the fair market value that is determined by local assessors to be the total taxable value of land and additions on the property. | Land | Improvement |
|---|---|---|---|---|
| 2025 | $72 | $642,500 | $190,900 | $451,600 |
| 2024 | $7,183 | $632,300 | $190,900 | $441,400 |
| 2023 | $6,429 | $578,100 | $186,900 | $391,200 |
| 2022 | $6,429 | $507,400 | $178,500 | $328,900 |
| 2021 | $6,135 | $463,400 | $162,200 | $301,200 |
| 2020 | $6,080 | $463,400 | $162,200 | $301,200 |
| 2018 | $5,159 | $431,000 | $154,400 | $276,600 |
| 2017 | $4,975 | $396,100 | $154,400 | $241,700 |
| 2016 | $4,813 | $396,100 | $154,400 | $241,700 |
| 2015 | $4,585 | $372,500 | $147,200 | $225,300 |
| 2014 | $4,454 | $358,000 | $140,000 | $218,000 |
Source: Public Records
Map
Nearby Homes
Your Personal Tour Guide
Ask me questions while you tour the home.