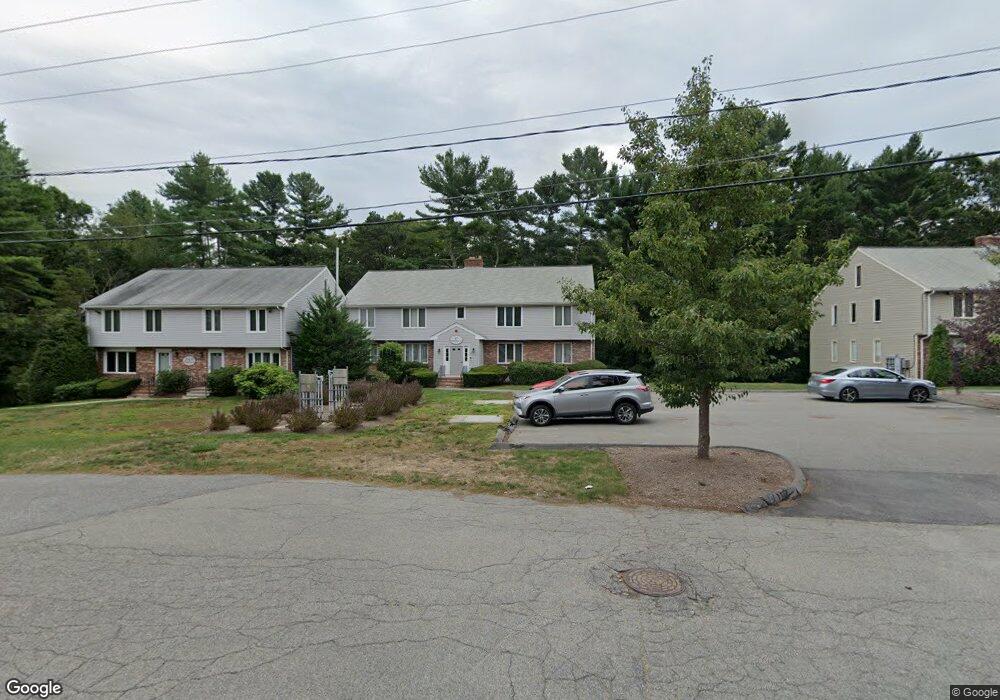
19 Pinebrook Ln South Easton, MA 02375
Estimated Value: $397,000 - $433,778
2
Beds
3
Baths
1,595
Sq Ft
$260/Sq Ft
Est. Value
About This Home
This home is located at 19 Pinebrook Ln, South Easton, MA 02375 and is currently estimated at $415,195, approximately $260 per square foot. 19 Pinebrook Ln is a home located in Bristol County with nearby schools including Easton Middle School and St Mary's Catholic School.
Ownership History
Date
Name
Owned For
Owner Type
Purchase Details
Closed on
Apr 25, 2014
Sold by
Awad Hossam M and Awad Doranne
Bought by
Siqueira Aolibama M
Current Estimated Value
Home Financials for this Owner
Home Financials are based on the most recent Mortgage that was taken out on this home.
Original Mortgage
$181,649
Outstanding Balance
$134,535
Interest Rate
3.75%
Mortgage Type
FHA
Estimated Equity
$280,660
Purchase Details
Closed on
May 27, 2003
Sold by
Parris Ira R and Easter Sharon R
Bought by
Awad Hossam M and Awad Doranne
Home Financials for this Owner
Home Financials are based on the most recent Mortgage that was taken out on this home.
Original Mortgage
$223,900
Interest Rate
5.86%
Mortgage Type
Purchase Money Mortgage
Purchase Details
Closed on
Jul 19, 2002
Sold by
Brabants Donald P
Bought by
Parris Ira R and Eater Sharon R
Home Financials for this Owner
Home Financials are based on the most recent Mortgage that was taken out on this home.
Original Mortgage
$207,150
Interest Rate
6.73%
Mortgage Type
Purchase Money Mortgage
Purchase Details
Closed on
Aug 7, 1998
Sold by
Burke Rt and Burke Edward A
Bought by
Brabants Donald P
Create a Home Valuation Report for This Property
The Home Valuation Report is an in-depth analysis detailing your home's value as well as a comparison with similar homes in the area
Home Values in the Area
Average Home Value in this Area
Purchase History
| Date | Buyer | Sale Price | Title Company |
|---|---|---|---|
| Siqueira Aolibama M | $185,000 | -- | |
| Siqueira Aolibama M | $185,000 | -- | |
| Awad Hossam M | $235,900 | -- | |
| Awad Hossam M | $235,900 | -- | |
| Parris Ira R | $229,482 | -- | |
| Brabants Donald P | $118,000 | -- | |
| Brabants Donald P | $118,000 | -- |
Source: Public Records
Mortgage History
| Date | Status | Borrower | Loan Amount |
|---|---|---|---|
| Open | Siqueira Aolibama M | $181,649 | |
| Closed | Brabants Donald P | $181,649 | |
| Previous Owner | Awad Hossam M | $223,900 | |
| Previous Owner | Brabants Donald P | $207,150 |
Source: Public Records
Tax History Compared to Growth
Tax History
| Year | Tax Paid | Tax Assessment Tax Assessment Total Assessment is a certain percentage of the fair market value that is determined by local assessors to be the total taxable value of land and additions on the property. | Land | Improvement |
|---|---|---|---|---|
| 2025 | $4,616 | $369,900 | $0 | $369,900 |
| 2024 | $5,072 | $379,900 | $0 | $379,900 |
| 2023 | $5,945 | $407,500 | $0 | $407,500 |
| 2022 | $4,659 | $302,700 | $0 | $302,700 |
| 2021 | $4,324 | $279,300 | $0 | $279,300 |
| 2020 | $4,296 | $279,300 | $0 | $279,300 |
| 2019 | $4,003 | $250,800 | $0 | $250,800 |
| 2018 | $3,801 | $234,500 | $0 | $234,500 |
| 2017 | $3,544 | $218,500 | $0 | $218,500 |
| 2016 | $2,887 | $178,300 | $0 | $178,300 |
| 2015 | $2,921 | $174,100 | $0 | $174,100 |
| 2014 | $2,899 | $174,100 | $0 | $174,100 |
Source: Public Records
Map
Nearby Homes
- 11 Hilltop Ln
- 6 Pinebrook Ln Unit 6
- 157 Highland St
- 36 Sierra Dr
- 28 Heidi Rd
- 9 Shagbark Rd
- 55 Eastman St
- 23 Estelle Marsan Dr
- 34 Kevins Way
- 18 Millfarm Dr
- 212 Mill St
- 0 Knollwood & 0 Rear Kensington
- 0 Kensington Rd
- 4 Plantation Rd
- Starling Plan at Sawmill Village
- Mallard Plan at Sawmill Village
- Goldfinch Plan at Sawmill Village
- Falcon Plan at Sawmill Village
- Cardinal Plan at Sawmill Village
- Sparrow Plan at Sawmill Village
- 44 Pinebrook Ln Unit 4
- 44 Pinebrook Ln Unit 3
- 44 Pinebrook Ln Unit 2
- 44 Pinebrook Ln Unit 1
- 21 Pinebrook Ln
- 19 Pinebrook Ln Unit 19
- 17 Pinebrook Ln Unit 4
- 17 Pinebrook Ln Unit 3
- 17 Pinebrook Ln Unit 2
- 17 Pinebrook Ln Unit 1
- 17 Pinebrook Ln Unit 3,17
- 15 Pinebrook Ln Unit 4
- 15 Pinebrook Ln Unit 3
- 15 Pinebrook Ln Unit 2
- 15 Pinebrook Ln Unit 1
- 13 Pinebrook Ln
- 30 Pinebrook Ln
- 30 Pinebrook Ln Unit 30
- 42 Pinebrook Ln
- 40 Pinebrook Ln