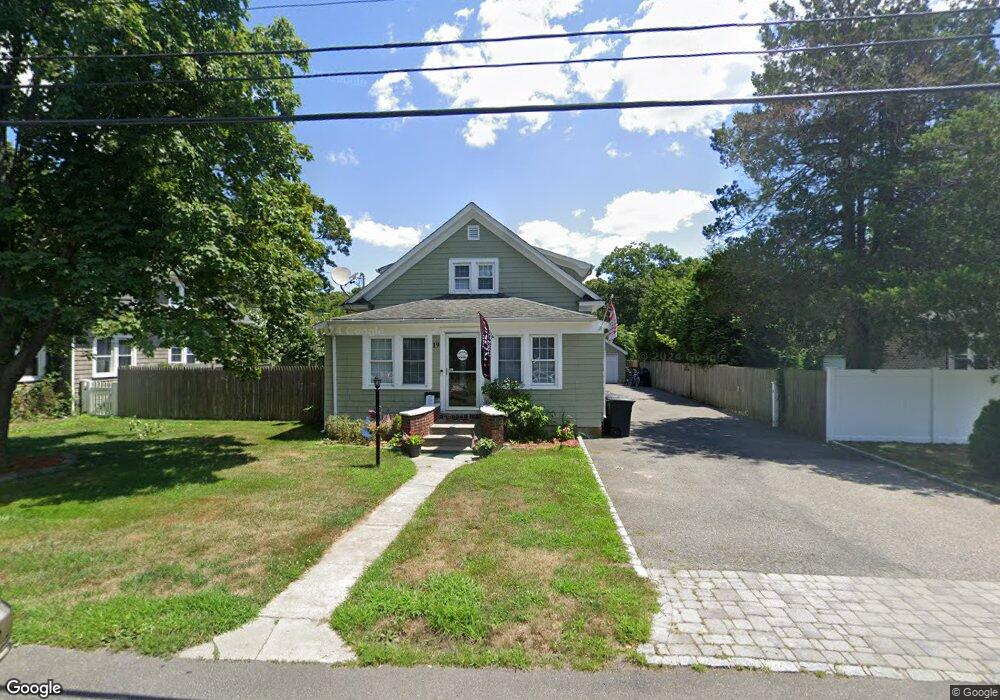
19 Pitt St Patchogue, NY 11772
Estimated Value: $528,990 - $589,000
3
Beds
1
Bath
1,428
Sq Ft
$387/Sq Ft
Est. Value
About This Home
This home is located at 19 Pitt St, Patchogue, NY 11772 and is currently estimated at $552,498, approximately $386 per square foot. 19 Pitt St is a home located in Suffolk County with nearby schools including Patchogue-Medford High School, Holy Angels Regional School, and Victory Christian Academy.
Ownership History
Date
Name
Owned For
Owner Type
Purchase Details
Closed on
Apr 1, 2022
Sold by
Phillips Stephen
Bought by
Larson George and Larson Emily
Current Estimated Value
Home Financials for this Owner
Home Financials are based on the most recent Mortgage that was taken out on this home.
Original Mortgage
$434,484
Outstanding Balance
$404,464
Interest Rate
3.76%
Mortgage Type
FHA
Estimated Equity
$148,034
Purchase Details
Closed on
Dec 1, 2017
Sold by
Phillips Stephen and Phillips Jennifer
Bought by
Phillips Stephen
Purchase Details
Closed on
Jun 24, 2005
Sold by
Sczla James L
Bought by
Phillips Stephen
Purchase Details
Closed on
Jun 15, 2000
Sold by
Day Lawrence E and Meinhold Anne F
Bought by
Scala James L and Scala Elizabeth J
Home Financials for this Owner
Home Financials are based on the most recent Mortgage that was taken out on this home.
Original Mortgage
$124,000
Interest Rate
8.48%
Create a Home Valuation Report for This Property
The Home Valuation Report is an in-depth analysis detailing your home's value as well as a comparison with similar homes in the area
Home Values in the Area
Average Home Value in this Area
Purchase History
| Date | Buyer | Sale Price | Title Company |
|---|---|---|---|
| Larson George | -- | None Available | |
| Larson George | -- | None Available | |
| Phillips Stephen | $100,000 | -- | |
| Phillips Stephen | $100,000 | -- | |
| Phillips Stephen | $100,000 | -- | |
| Phillips Stephen | $341,000 | Audrey Bloom | |
| Phillips Stephen | $341,000 | Audrey Bloom | |
| Scala James L | $155,000 | -- | |
| Scala James L | $155,000 | -- |
Source: Public Records
Mortgage History
| Date | Status | Borrower | Loan Amount |
|---|---|---|---|
| Open | Larson George | $434,484 | |
| Closed | Larson George | $434,484 | |
| Previous Owner | Scala James L | $124,000 |
Source: Public Records
Tax History
| Year | Tax Paid | Tax Assessment Tax Assessment Total Assessment is a certain percentage of the fair market value that is determined by local assessors to be the total taxable value of land and additions on the property. | Land | Improvement |
|---|---|---|---|---|
| 2024 | $5,182 | $1,420 | $220 | $1,200 |
| 2023 | $5,182 | $1,420 | $220 | $1,200 |
| 2022 | $5,791 | $1,420 | $220 | $1,200 |
| 2021 | $5,791 | $1,420 | $220 | $1,200 |
| 2020 | $5,941 | $1,420 | $220 | $1,200 |
| 2019 | $5,941 | $0 | $0 | $0 |
| 2018 | $5,610 | $1,420 | $220 | $1,200 |
| 2017 | $5,610 | $1,420 | $220 | $1,200 |
| 2016 | $5,483 | $1,420 | $220 | $1,200 |
| 2015 | -- | $1,420 | $220 | $1,200 |
| 2014 | -- | $1,420 | $220 | $1,200 |
Source: Public Records
Map
Nearby Homes
Your Personal Tour Guide
Ask me questions while you tour the home.