Estimated Value: $1,722,828 - $2,014,000
4
Beds
3
Baths
3,700
Sq Ft
$496/Sq Ft
Est. Value
About This Home
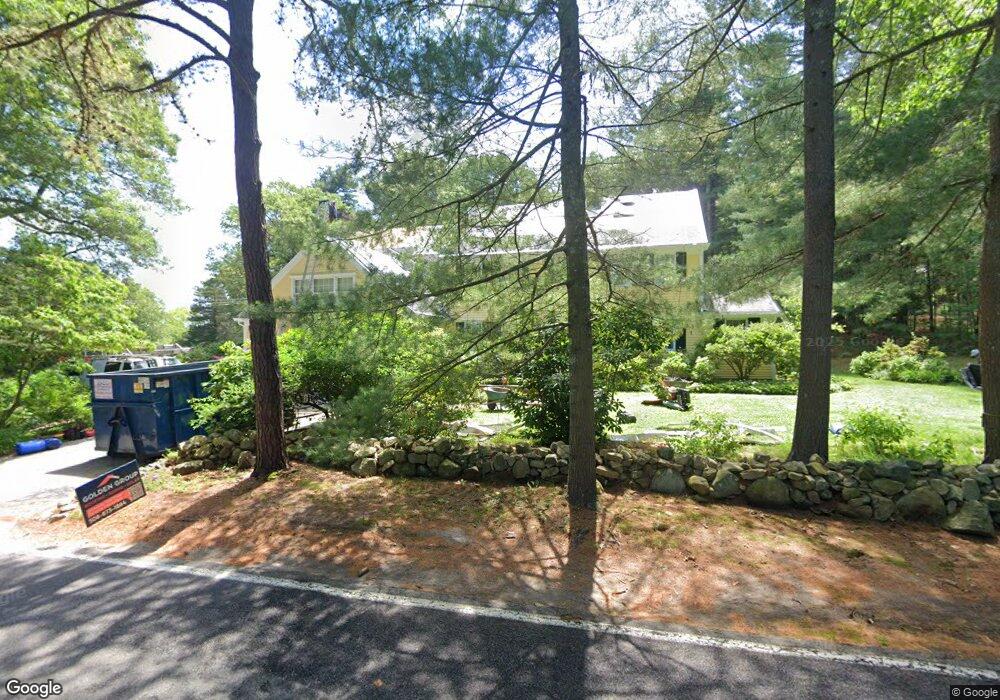
This home is located at 19 Powisset St, Dover, MA 02030 and is currently estimated at $1,833,707, approximately $495 per square foot. 19 Powisset St is a home located in Norfolk County with nearby schools including Chickering Elementary School, Dover-Sherborn Regional Middle School, and Dover-Sherborn Regional High School.
Ownership History
Date
Name
Owned For
Owner Type
Purchase Details
Closed on
Jul 29, 2005
Sold by
Cary Eleanor C and Cary Trumbull
Bought by
Senger Donald R and Senger Elissa A
Current Estimated Value
Home Financials for this Owner
Home Financials are based on the most recent Mortgage that was taken out on this home.
Original Mortgage
$359,650
Interest Rate
5.67%
Mortgage Type
Purchase Money Mortgage
Purchase Details
Closed on
Oct 16, 1987
Sold by
Canney Tr Bruce K
Bought by
Carey Trumbull
Create a Home Valuation Report for This Property
The Home Valuation Report is an in-depth analysis detailing your home's value as well as a comparison with similar homes in the area
Home Values in the Area
Average Home Value in this Area
Purchase History
| Date | Buyer | Sale Price | Title Company |
|---|---|---|---|
| Senger Donald R | $1,137,000 | -- | |
| Senger Donald R | $1,137,000 | -- | |
| Carey Trumbull | $600,000 | -- |
Source: Public Records
Mortgage History
| Date | Status | Borrower | Loan Amount |
|---|---|---|---|
| Open | Carey Trumbull | $356,000 | |
| Closed | Senger Donald R | $359,650 | |
| Previous Owner | Carey Trumbull | $373,740 | |
| Closed | Carey Trumbull | $0 |
Source: Public Records
Tax History
| Year | Tax Paid | Tax Assessment Tax Assessment Total Assessment is a certain percentage of the fair market value that is determined by local assessors to be the total taxable value of land and additions on the property. | Land | Improvement |
|---|---|---|---|---|
| 2025 | $18,402 | $1,632,800 | $1,129,100 | $503,700 |
| 2024 | $17,532 | $1,599,600 | $1,129,100 | $470,500 |
| 2023 | $17,733 | $1,454,700 | $1,032,700 | $422,000 |
| 2022 | $17,431 | $1,403,500 | $1,032,700 | $370,800 |
| 2021 | $16,511 | $1,280,900 | $923,800 | $357,100 |
| 2020 | $16,447 | $1,280,900 | $923,800 | $357,100 |
| 2019 | $16,562 | $1,280,900 | $923,800 | $357,100 |
| 2018 | $12,916 | $1,005,900 | $665,200 | $340,700 |
| 2017 | $12,554 | $962,000 | $610,800 | $351,200 |
| 2016 | $12,391 | $962,000 | $610,800 | $351,200 |
| 2015 | $11,836 | $932,000 | $580,800 | $351,200 |
Source: Public Records
Map
Nearby Homes
Your Personal Tour Guide
Ask me questions while you tour the home.