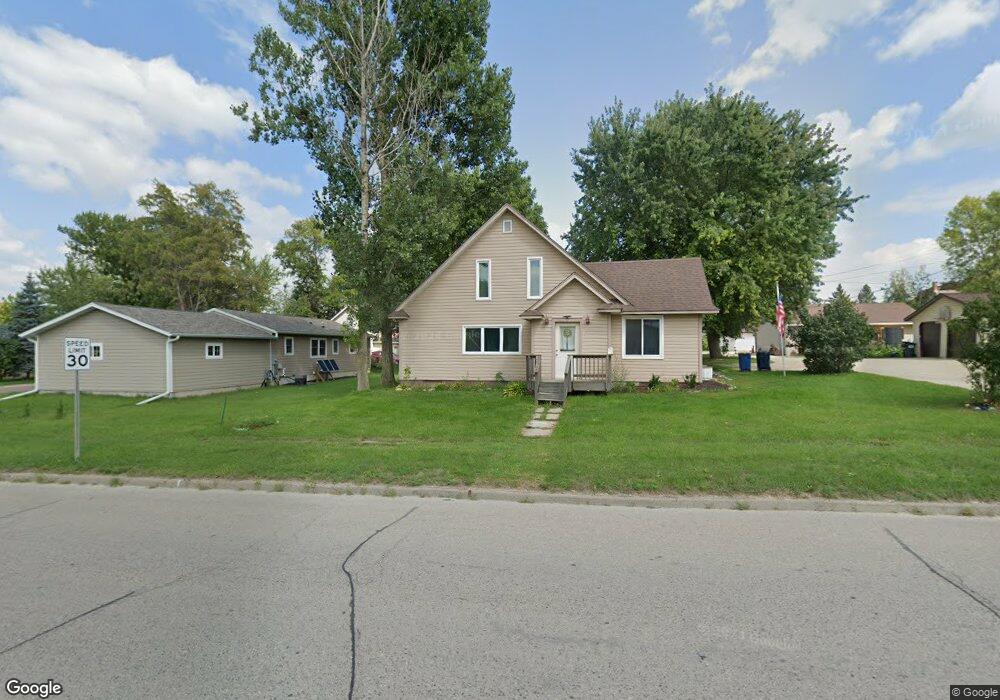
19 Red Wing Ave Kenyon, MN 55946
Estimated Value: $195,000 - $202,937
3
Beds
3
Baths
1,315
Sq Ft
$152/Sq Ft
Est. Value
About This Home
This home is located at 19 Red Wing Ave, Kenyon, MN 55946 and is currently estimated at $199,234, approximately $151 per square foot. 19 Red Wing Ave is a home located in Goodhue County with nearby schools including Kenyon-Wanamingo Elementary School, Kenyon-Wanamingo Middle School, and Kenyon-Wanamingo Senior High School.
Ownership History
Date
Name
Owned For
Owner Type
Purchase Details
Closed on
Sep 11, 2025
Sold by
Alexon Samantha Marie and Strand Samantha Marie
Bought by
Alexon Samantha Marie
Current Estimated Value
Purchase Details
Closed on
Mar 27, 2019
Sold by
Lee Cynthia K
Bought by
Strand Samantha M
Purchase Details
Closed on
Feb 9, 2019
Sold by
Winslow Sharon L and Winslow Ricky P
Bought by
Lee Cynthia K
Purchase Details
Closed on
May 20, 2003
Sold by
Greenslade Duane
Bought by
Lee Arliss L and Lee Cynthia K
Purchase Details
Closed on
Oct 2, 2000
Sold by
Starch Jane L
Bought by
Greenslade Duane D
Create a Home Valuation Report for This Property
The Home Valuation Report is an in-depth analysis detailing your home's value as well as a comparison with similar homes in the area
Purchase History
| Date | Buyer | Sale Price | Title Company |
|---|---|---|---|
| Alexon Samantha Marie | $500 | None Listed On Document | |
| Strand Samantha M | $115,000 | -- | |
| Lee Cynthia K | -- | -- | |
| Lee Arliss L | $132,500 | -- | |
| Greenslade Duane D | $60,000 | -- |
Source: Public Records
Tax History
| Year | Tax Paid | Tax Assessment Tax Assessment Total Assessment is a certain percentage of the fair market value that is determined by local assessors to be the total taxable value of land and additions on the property. | Land | Improvement |
|---|---|---|---|---|
| 2025 | $1,958 | $160,900 | $38,500 | $122,400 |
| 2024 | $1,958 | $157,300 | $38,500 | $118,800 |
| 2023 | $968 | $147,300 | $38,500 | $108,800 |
| 2022 | $1,774 | $142,200 | $35,400 | $106,800 |
| 2021 | $1,602 | $121,200 | $32,300 | $88,900 |
| 2020 | $1,606 | $119,700 | $32,300 | $87,400 |
| 2019 | $1,822 | $120,300 | $32,300 | $88,000 |
| 2018 | $1,774 | $97,000 | $21,600 | $75,400 |
| 2017 | $1,658 | $99,800 | $21,600 | $78,200 |
| 2016 | $1,532 | $94,000 | $21,600 | $72,400 |
| 2015 | $1,504 | $86,300 | $21,600 | $64,700 |
| 2014 | -- | $83,200 | $18,500 | $64,700 |
Source: Public Records
Map
Nearby Homes
- 628 Front St
- 103 Bullis St
- 412 3rd St
- 413 Fawn Run
- 411 Bullis St
- 416 Buckshot Ct
- 207 Whitetail Ln
- 206 Whitetail Ln
- 450 Engel Dr
- 550 Engel Dr
- 213 6th St
- 451 Engel Dr
- 705 State St
- -XXX 20th Ave
- 47155 Monkey Valley Hollow
- 44241 70th Ave
- 52377 120th Ave
- 420 Kielmeyer Ave NE
- 10055 460th St
- 124 Ellington St
Your Personal Tour Guide
Ask me questions while you tour the home.