19 Ridge Rd Groton, CT 06340
Estimated Value: $1,286,000 - $1,456,973
4
Beds
2
Baths
2,340
Sq Ft
$578/Sq Ft
Est. Value
About This Home
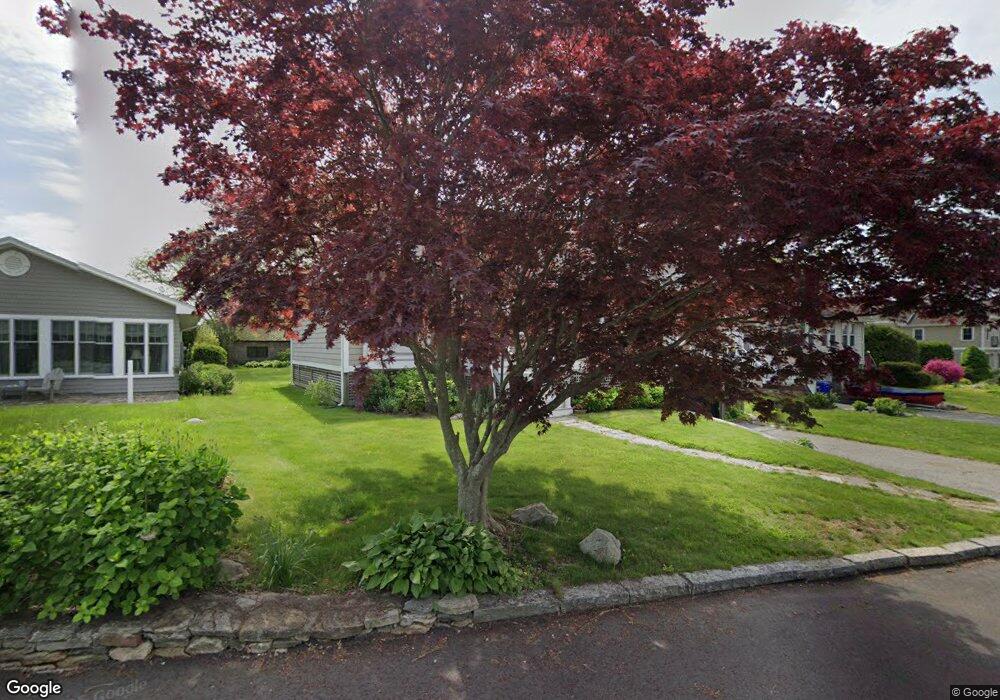
This home is located at 19 Ridge Rd, Groton, CT 06340 and is currently estimated at $1,352,658, approximately $578 per square foot. 19 Ridge Rd is a home located in New London County with nearby schools including Groton Middle School and Robert E. Fitch High School.
Ownership History
Date
Name
Owned For
Owner Type
Purchase Details
Closed on
Sep 13, 2024
Sold by
Hebard Charles W
Bought by
Charles W Hebard T W and Charles Hebard
Current Estimated Value
Purchase Details
Closed on
Aug 15, 2022
Sold by
Urbanski Steven R and Urbanski Jennifer E
Bought by
Hebard Charles W
Purchase Details
Closed on
Mar 25, 2021
Sold by
Ruth Elizabeth Volgenau T
Bought by
Urbanski Steven R and Urbanski Jennifer E
Create a Home Valuation Report for This Property
The Home Valuation Report is an in-depth analysis detailing your home's value as well as a comparison with similar homes in the area
Purchase History
| Date | Buyer | Sale Price | Title Company |
|---|---|---|---|
| Charles W Hebard T W | -- | None Available | |
| Charles W Hebard T W | -- | None Available | |
| Hebard Charles W | $1,175,000 | None Available | |
| Hebard Charles W | $1,175,000 | None Available | |
| Urbanski Steven R | $760,000 | None Available | |
| Urbanski Steven R | $760,000 | None Available |
Source: Public Records
Tax History
| Year | Tax Paid | Tax Assessment Tax Assessment Total Assessment is a certain percentage of the fair market value that is determined by local assessors to be the total taxable value of land and additions on the property. | Land | Improvement |
|---|---|---|---|---|
| 2025 | $15,418 | $547,330 | $387,590 | $159,740 |
| 2024 | $14,471 | $547,330 | $387,590 | $159,740 |
| 2023 | $13,951 | $547,330 | $319,130 | $228,200 |
| 2022 | $13,221 | $528,640 | $319,130 | $209,510 |
| 2021 | $11,841 | $393,260 | $255,290 | $137,970 |
| 2020 | $11,667 | $393,260 | $255,290 | $137,970 |
| 2019 | $11,187 | $393,260 | $255,290 | $137,970 |
| 2018 | $10,964 | $393,260 | $255,290 | $137,970 |
| 2017 | $10,748 | $393,260 | $255,290 | $137,970 |
| 2016 | $10,822 | $437,710 | $268,100 | $169,610 |
| 2015 | $10,481 | $437,710 | $268,100 | $169,610 |
| 2014 | $10,144 | $437,710 | $268,100 | $169,610 |
Source: Public Records
Map
Nearby Homes
Your Personal Tour Guide
Ask me questions while you tour the home.