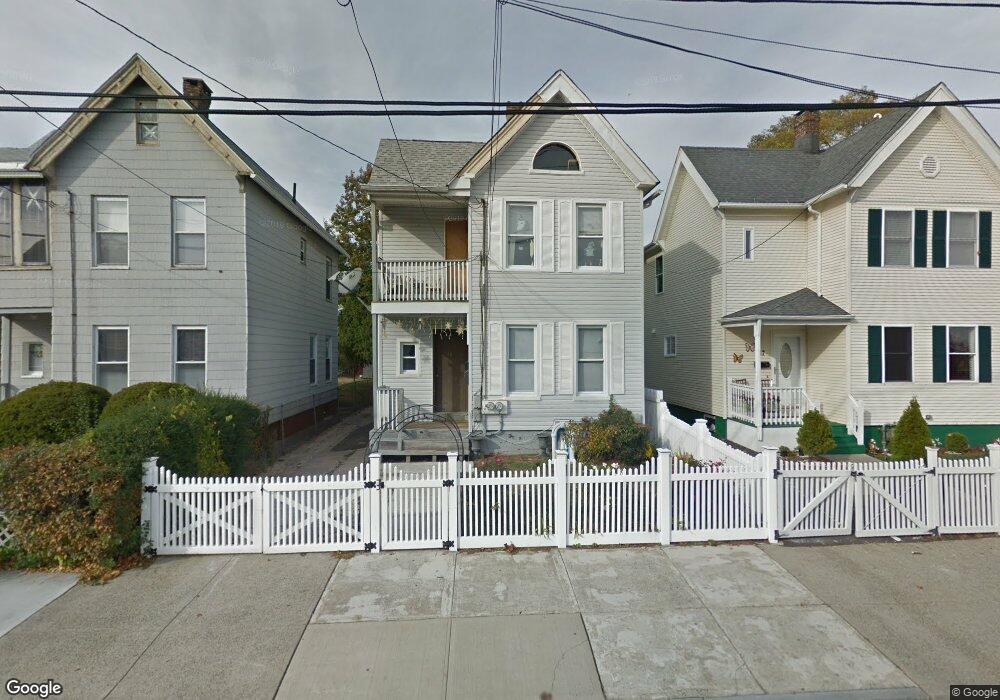
19 Rosette St New Haven, CT 06519
The Hill NeighborhoodEstimated Value: $286,000 - $338,000
4
Beds
3
Baths
1,944
Sq Ft
$163/Sq Ft
Est. Value
About This Home
This home is located at 19 Rosette St, New Haven, CT 06519 and is currently estimated at $317,831, approximately $163 per square foot. 19 Rosette St is a home located in New Haven County with nearby schools including John C. Daniels and St Martin De Porres Academy.
Ownership History
Date
Name
Owned For
Owner Type
Purchase Details
Closed on
Jul 1, 2003
Sold by
Bruno Ralph A
Bought by
Hernandez Raul
Current Estimated Value
Home Financials for this Owner
Home Financials are based on the most recent Mortgage that was taken out on this home.
Original Mortgage
$137,837
Outstanding Balance
$59,792
Interest Rate
5.53%
Estimated Equity
$258,039
Purchase Details
Closed on
Feb 26, 2002
Sold by
Conn Housing Co Llc
Bought by
Bruno Ralph A
Home Financials for this Owner
Home Financials are based on the most recent Mortgage that was taken out on this home.
Original Mortgage
$98,100
Interest Rate
7.08%
Create a Home Valuation Report for This Property
The Home Valuation Report is an in-depth analysis detailing your home's value as well as a comparison with similar homes in the area
Home Values in the Area
Average Home Value in this Area
Purchase History
| Date | Buyer | Sale Price | Title Company |
|---|---|---|---|
| Hernandez Raul | $140,000 | -- | |
| Bruno Ralph A | $109,000 | -- |
Source: Public Records
Mortgage History
| Date | Status | Borrower | Loan Amount |
|---|---|---|---|
| Open | Bruno Ralph A | $137,837 | |
| Previous Owner | Bruno Ralph A | $98,100 | |
| Previous Owner | Bruno Ralph A | $23,808 |
Source: Public Records
Tax History
| Year | Tax Paid | Tax Assessment Tax Assessment Total Assessment is a certain percentage of the fair market value that is determined by local assessors to be the total taxable value of land and additions on the property. | Land | Improvement |
|---|---|---|---|---|
| 2025 | $5,695 | $144,550 | $23,310 | $121,240 |
| 2024 | $5,565 | $144,550 | $23,310 | $121,240 |
| 2023 | $5,377 | $144,550 | $23,310 | $121,240 |
| 2022 | $5,746 | $144,550 | $23,310 | $121,240 |
| 2021 | $3,585 | $81,690 | $20,090 | $61,600 |
| 2020 | $3,585 | $81,690 | $20,090 | $61,600 |
| 2019 | $3,511 | $81,690 | $20,090 | $61,600 |
| 2018 | $3,511 | $81,690 | $20,090 | $61,600 |
| 2017 | $3,160 | $81,690 | $20,090 | $61,600 |
| 2016 | $2,641 | $63,560 | $11,480 | $52,080 |
| 2015 | $2,641 | $63,560 | $11,480 | $52,080 |
| 2014 | $2,641 | $63,560 | $11,480 | $52,080 |
Source: Public Records
Map
Nearby Homes