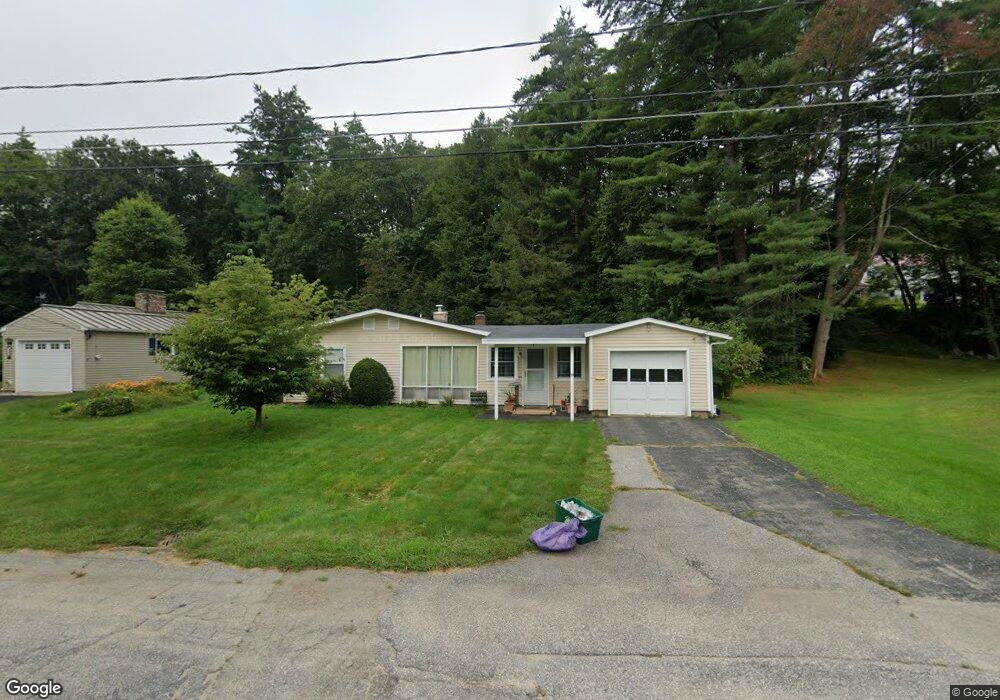
19 Rundlett St Concord, NH 03301
South End NeighborhoodEstimated Value: $423,234 - $470,000
3
Beds
2
Baths
1,169
Sq Ft
$382/Sq Ft
Est. Value
About This Home
This home is located at 19 Rundlett St, Concord, NH 03301 and is currently estimated at $447,059, approximately $382 per square foot. 19 Rundlett St is a home located in Merrimack County with nearby schools including Abbot-Downing School, Rundlett Middle School, and Concord High School.
Ownership History
Date
Name
Owned For
Owner Type
Purchase Details
Closed on
Oct 13, 2009
Sold by
Small Janet E
Bought by
Maloney Mary E
Current Estimated Value
Home Financials for this Owner
Home Financials are based on the most recent Mortgage that was taken out on this home.
Original Mortgage
$131,200
Outstanding Balance
$85,934
Interest Rate
5.14%
Mortgage Type
Purchase Money Mortgage
Estimated Equity
$361,125
Create a Home Valuation Report for This Property
The Home Valuation Report is an in-depth analysis detailing your home's value as well as a comparison with similar homes in the area
Home Values in the Area
Average Home Value in this Area
Purchase History
| Date | Buyer | Sale Price | Title Company |
|---|---|---|---|
| Maloney Mary E | $164,000 | -- |
Source: Public Records
Mortgage History
| Date | Status | Borrower | Loan Amount |
|---|---|---|---|
| Open | Maloney Mary E | $131,200 |
Source: Public Records
Tax History Compared to Growth
Tax History
| Year | Tax Paid | Tax Assessment Tax Assessment Total Assessment is a certain percentage of the fair market value that is determined by local assessors to be the total taxable value of land and additions on the property. | Land | Improvement |
|---|---|---|---|---|
| 2024 | $7,072 | $255,400 | $120,800 | $134,600 |
| 2023 | $6,860 | $255,400 | $120,800 | $134,600 |
| 2022 | $6,612 | $255,400 | $120,800 | $134,600 |
| 2021 | $6,416 | $255,400 | $120,800 | $134,600 |
| 2020 | $5,925 | $221,400 | $95,200 | $126,200 |
| 2019 | $5,617 | $202,200 | $98,800 | $103,400 |
| 2018 | $5,630 | $199,700 | $99,200 | $100,500 |
| 2017 | $5,479 | $194,000 | $99,200 | $94,800 |
| 2016 | $5,183 | $187,300 | $97,300 | $90,000 |
| 2015 | $4,946 | $182,400 | $105,600 | $76,800 |
| 2014 | $4,890 | $182,400 | $105,600 | $76,800 |
| 2013 | -- | $180,400 | $105,600 | $74,800 |
| 2012 | -- | $182,000 | $111,200 | $70,800 |
Source: Public Records
Map
Nearby Homes
- 22 Wilson Ave
- 15 Wilson Ave
- 0 South St Unit 4969509
- 122 South St
- 12 Avon St
- 105 S Main St
- 289 South St
- 376 S Main St
- 33 Spruce St
- 0 Spruce St Unit 88
- 24 Badger St
- 47 South St
- 14 Downing St
- 53 Heather Ln
- 2 Kensington Rd
- 14-16 Perley St
- 10 Perley St
- 1 Kensington Rd
- 87 S Main St Unit 2
- 54 Pleasant St Unit 8