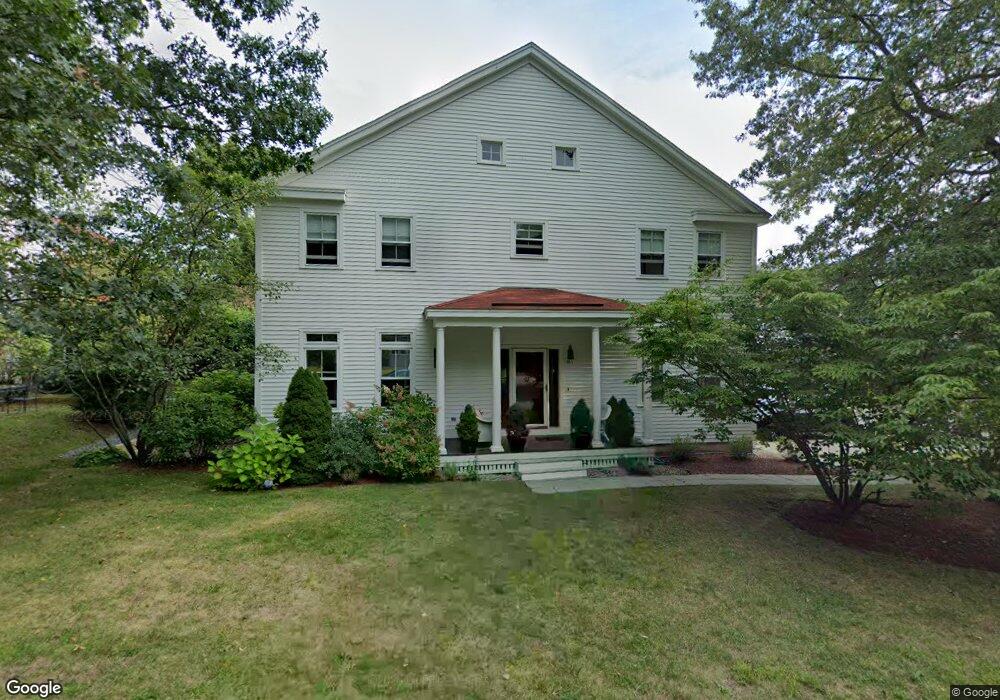
19 S Commons Unit B Lincoln, MA 01773
Estimated Value: $558,326 - $669,000
2
Beds
2
Baths
1,232
Sq Ft
$482/Sq Ft
Est. Value
About This Home
This home is located at 19 S Commons Unit B, Lincoln, MA 01773 and is currently estimated at $594,082, approximately $482 per square foot. 19 S Commons Unit B is a home located in Middlesex County with nearby schools including Lincoln-Sudbury Regional High School and Tremont School.
Ownership History
Date
Name
Owned For
Owner Type
Purchase Details
Closed on
May 30, 2003
Sold by
Thomas Nancy B and Wyatt Nancy B
Bought by
Kagansky Ilya
Current Estimated Value
Home Financials for this Owner
Home Financials are based on the most recent Mortgage that was taken out on this home.
Original Mortgage
$190,000
Interest Rate
5.86%
Mortgage Type
Purchase Money Mortgage
Purchase Details
Closed on
Oct 26, 2001
Sold by
Krapf Lynne A
Bought by
Thomas Nancy
Home Financials for this Owner
Home Financials are based on the most recent Mortgage that was taken out on this home.
Original Mortgage
$260,000
Interest Rate
6.86%
Mortgage Type
Purchase Money Mortgage
Purchase Details
Closed on
Oct 31, 1996
Sold by
Lincoln House Assoc Lp
Bought by
Krapf Lynne A
Home Financials for this Owner
Home Financials are based on the most recent Mortgage that was taken out on this home.
Original Mortgage
$155,850
Interest Rate
8.07%
Mortgage Type
Purchase Money Mortgage
Create a Home Valuation Report for This Property
The Home Valuation Report is an in-depth analysis detailing your home's value as well as a comparison with similar homes in the area
Home Values in the Area
Average Home Value in this Area
Purchase History
| Date | Buyer | Sale Price | Title Company |
|---|---|---|---|
| Kagansky Ilya | $357,500 | -- | |
| Thomas Nancy | $325,000 | -- | |
| Krapf Lynne A | $194,826 | -- |
Source: Public Records
Mortgage History
| Date | Status | Borrower | Loan Amount |
|---|---|---|---|
| Open | Krapf Lynne A | $138,600 | |
| Closed | Krapf Lynne A | $100,000 | |
| Closed | Kagansky Ilya | $190,000 | |
| Previous Owner | Thomas Nancy | $260,000 | |
| Previous Owner | Krapf Lynne A | $155,850 | |
| Closed | Krapf Lynne A | $19,425 |
Source: Public Records
Tax History Compared to Growth
Tax History
| Year | Tax Paid | Tax Assessment Tax Assessment Total Assessment is a certain percentage of the fair market value that is determined by local assessors to be the total taxable value of land and additions on the property. | Land | Improvement |
|---|---|---|---|---|
| 2025 | $69 | $540,700 | $0 | $540,700 |
| 2024 | $6,524 | $506,100 | $0 | $506,100 |
| 2023 | $6,709 | $482,000 | $0 | $482,000 |
| 2022 | $7,037 | $471,300 | $0 | $471,300 |
| 2021 | $6,793 | $437,700 | $0 | $437,700 |
| 2020 | $6,225 | $405,300 | $0 | $405,300 |
| 2019 | $5,504 | $392,300 | $0 | $392,300 |
| 2018 | $5,335 | $392,300 | $0 | $392,300 |
| 2017 | $5,025 | $366,800 | $0 | $366,800 |
| 2016 | $5,087 | $363,600 | $0 | $363,600 |
| 2015 | $4,965 | $350,900 | $0 | $350,900 |
| 2014 | $4,780 | $331,700 | $0 | $331,700 |
Source: Public Records
Map
Nearby Homes
- 5 South Commons Unit D
- 36 Indian Camp Ln Unit D
- 29 S Commons Unit D
- 241 Shadyside Ave
- 16 Old Cambridge Turnpike
- 22 Old Cambridge Turnpike
- 646 Cambridge Turnpike
- 10 Reiling Pond Rd
- 9 Garland Rd
- 16 Hatch Farm Ln
- 28 Hatch Farm Ln
- 10 Hatch Farm Ln
- 6 Parker Rd
- 644 Old Bedford Rd
- 7 Blue Heron Way
- 50 Summer St Unit A
- 52 Summer St Unit B
- 84 Davison Dr
- 39 Neillian St Unit 39
- 75 Westview St
- 19 S Commons Unit D
- 19 S Commons Unit C
- 19 S Commons Unit A
- 19 South Commons Unit C
- 19 S Commons Unit A-19
- 19a South Commons Unit 19 A
- 15 S Commons Unit D
- 15 S Commons Unit C
- 15 S Commons Unit B
- 15 S Commons Unit A
- 15 South Commons Unit D
- 15 S Commons
- 15-D South Commons Unit D,15
- 15 South Commons Unit C
- 15C S Commons
- 15 A South Commons Unit 15A
- 15 C South Commons Unit 15C
- 23 S Commons
- 23 S Commons Unit D
- 23 S Commons Unit C