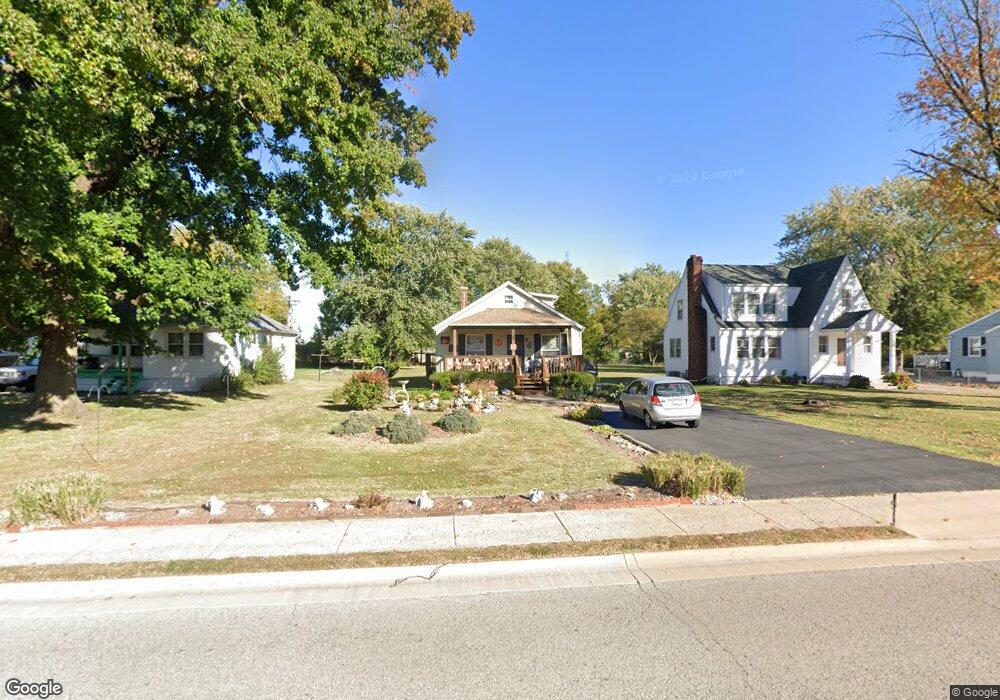
19 S Ruby Ln Fairview Heights, IL 62208
Estimated Value: $113,000 - $141,000
Studio
--
Bath
816
Sq Ft
$155/Sq Ft
Est. Value
About This Home
This home is located at 19 S Ruby Ln, Fairview Heights, IL 62208 and is currently estimated at $126,700, approximately $155 per square foot. 19 S Ruby Ln is a home located in St. Clair County with nearby schools including William Holliday Elementary School, Pontiac William Holliday Jr High School, and Holy Trinity Catholic School.
Ownership History
Date
Name
Owned For
Owner Type
Purchase Details
Closed on
Mar 26, 2009
Sold by
Andrews Dimel J
Bought by
Rencher James E and Rencher Minnie M
Current Estimated Value
Home Financials for this Owner
Home Financials are based on the most recent Mortgage that was taken out on this home.
Original Mortgage
$80,023
Outstanding Balance
$51,343
Interest Rate
5.22%
Mortgage Type
FHA
Estimated Equity
$75,357
Purchase Details
Closed on
Mar 18, 2002
Sold by
Vartanian Samuel W and Vartanian Jayne E
Bought by
Andrews Dimel J
Home Financials for this Owner
Home Financials are based on the most recent Mortgage that was taken out on this home.
Original Mortgage
$81,172
Interest Rate
6.95%
Mortgage Type
VA
Create a Home Valuation Report for This Property
The Home Valuation Report is an in-depth analysis detailing your home's value as well as a comparison with similar homes in the area
Home Values in the Area
Average Home Value in this Area
Purchase History
| Date | Buyer | Sale Price | Title Company |
|---|---|---|---|
| Rencher James E | $81,500 | Fatic | |
| Andrews Dimel J | $79,000 | -- |
Source: Public Records
Mortgage History
| Date | Status | Borrower | Loan Amount |
|---|---|---|---|
| Open | Rencher James E | $80,023 | |
| Previous Owner | Andrews Dimel J | $81,172 |
Source: Public Records
Tax History
| Year | Tax Paid | Tax Assessment Tax Assessment Total Assessment is a certain percentage of the fair market value that is determined by local assessors to be the total taxable value of land and additions on the property. | Land | Improvement |
|---|---|---|---|---|
| 2024 | $1,267 | $43,613 | $3,833 | $39,780 |
| 2023 | $1,327 | $38,588 | $3,391 | $35,197 |
| 2022 | $1,353 | $37,249 | $3,325 | $33,924 |
| 2021 | $1,390 | $35,354 | $3,156 | $32,198 |
| 2020 | $1,398 | $33,489 | $2,989 | $30,500 |
| 2019 | $1,399 | $33,489 | $2,989 | $30,500 |
| 2018 | $1,433 | $32,655 | $3,196 | $29,459 |
| 2017 | $1,435 | $31,330 | $3,066 | $28,264 |
| 2016 | $1,434 | $30,623 | $2,997 | $27,626 |
| 2014 | $1,366 | $31,741 | $4,168 | $27,573 |
| 2013 | $1,784 | $32,326 | $4,245 | $28,081 |
Source: Public Records
Map
Nearby Homes
Your Personal Tour Guide
Ask me questions while you tour the home.