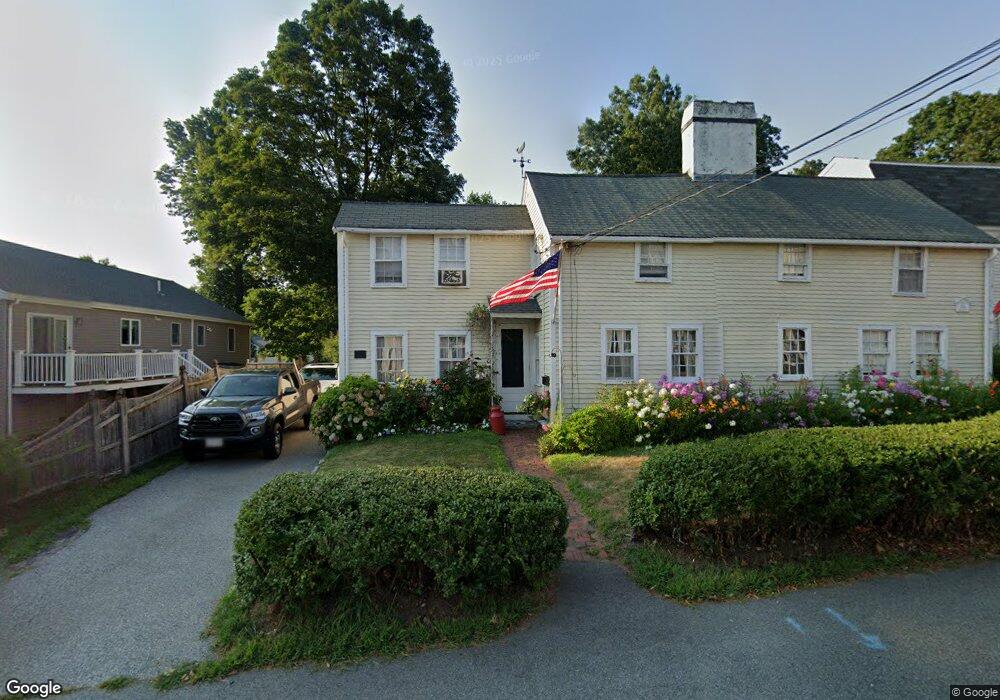
19 Salem St Unit 21 Wakefield, MA 01880
Lakeside NeighborhoodEstimated Value: $980,000 - $1,181,000
2
Beds
4
Baths
4,131
Sq Ft
$273/Sq Ft
Est. Value
About This Home
This home is located at 19 Salem St Unit 21, Wakefield, MA 01880 and is currently estimated at $1,125,934, approximately $272 per square foot. 19 Salem St Unit 21 is a home located in Middlesex County with nearby schools including Wakefield Memorial High School, St Joseph School, and Odyssey Day School.
Ownership History
Date
Name
Owned For
Owner Type
Purchase Details
Closed on
Jul 3, 2001
Sold by
Sweeney Jerome and Sweeney Mary S
Bought by
Sweeney Christopher and Sweeney Veronica
Current Estimated Value
Home Financials for this Owner
Home Financials are based on the most recent Mortgage that was taken out on this home.
Original Mortgage
$176,000
Outstanding Balance
$67,826
Interest Rate
7.14%
Mortgage Type
Purchase Money Mortgage
Estimated Equity
$1,058,108
Create a Home Valuation Report for This Property
The Home Valuation Report is an in-depth analysis detailing your home's value as well as a comparison with similar homes in the area
Home Values in the Area
Average Home Value in this Area
Purchase History
| Date | Buyer | Sale Price | Title Company |
|---|---|---|---|
| Sweeney Christopher | $220,000 | -- |
Source: Public Records
Mortgage History
| Date | Status | Borrower | Loan Amount |
|---|---|---|---|
| Open | Sweeney Christopher | $176,000 |
Source: Public Records
Tax History
| Year | Tax Paid | Tax Assessment Tax Assessment Total Assessment is a certain percentage of the fair market value that is determined by local assessors to be the total taxable value of land and additions on the property. | Land | Improvement |
|---|---|---|---|---|
| 2025 | $11,369 | $1,001,700 | $398,700 | $603,000 |
| 2024 | $10,739 | $954,600 | $380,000 | $574,600 |
| 2023 | $10,762 | $917,500 | $365,200 | $552,300 |
| 2022 | $10,371 | $841,800 | $335,100 | $506,700 |
| 2021 | $9,208 | $723,300 | $289,600 | $433,700 |
| 2020 | $8,778 | $687,400 | $275,200 | $412,200 |
| 2019 | $8,514 | $663,600 | $265,700 | $397,900 |
| 2018 | $4,838 | $687,700 | $253,700 | $434,000 |
| 2017 | $8,453 | $648,700 | $239,300 | $409,400 |
| 2016 | $7,330 | $543,400 | $211,600 | $331,800 |
| 2015 | $7,183 | $532,900 | $207,500 | $325,400 |
| 2014 | $6,676 | $522,400 | $203,400 | $319,000 |
Source: Public Records
Map
Nearby Homes
- 57 Wave Ave
- 16 Pleasant St
- 43-45 Crescent St
- 29 Cordis St
- 10 Wakefield Ave Unit B
- 68 Preston St Unit 6D
- 62 Foundry St Unit 204
- 62 Foundry St Unit 402
- 62 Foundry St Unit 414
- 62 Foundry St Unit 210
- 1 Traverse St Unit E
- 69 Foundry St Unit 310
- 69 Foundry St Unit 416
- 270 Lowell St
- 21 Herbert St Unit A
- 67 Woodcrest Dr
- 248 Albion St Unit 231
- 248 Albion St Unit 321
- 252 Albion St Unit 3
- 61 Nahant St
- 3 Rochelle Dr
- 23 Salem St Unit 23A
- 20 Salem St
- 22 Salem St
- 22 Salem St Unit 1
- 18 Salem St
- 18 Salem St Unit 18A
- 18 Salem St
- 18 Salem St Unit 1
- 7 Rochelle Dr
- 24 Salem St
- 16 Salem St
- 16 Salem St
- 26 Salem St
- 26 Salem St Unit 3
- 26 Salem St Unit 1
- 26 Salem St Unit 26
- 26 Salem St Unit 2
- 11 Salem St
- 11 Salem St Unit 2
Your Personal Tour Guide
Ask me questions while you tour the home.