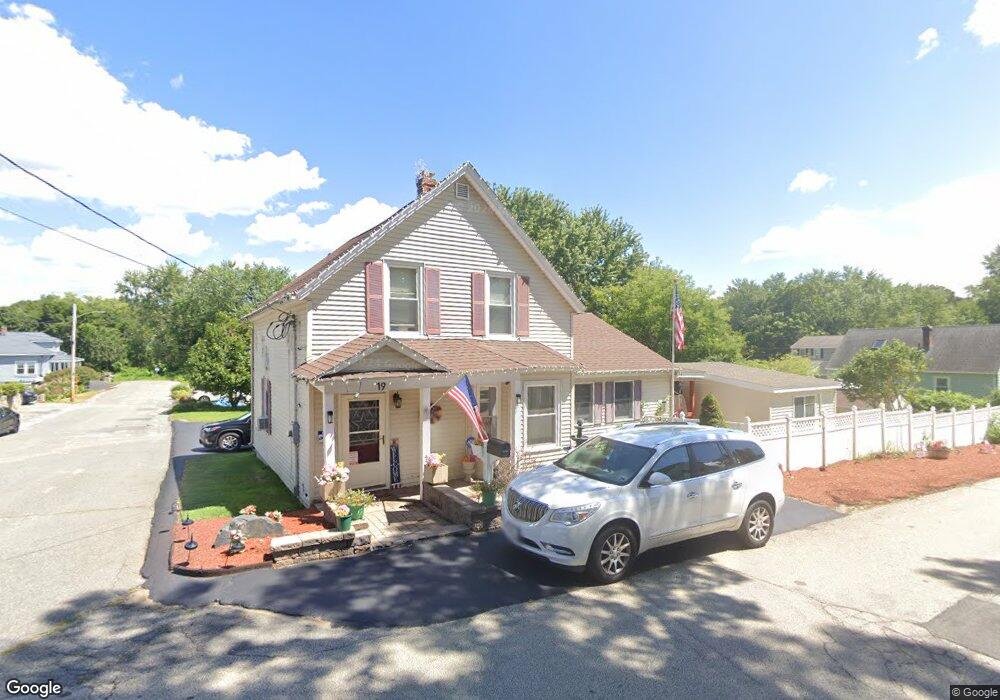
19 Sampson St Methuen, MA 01844
Downtown Methuen NeighborhoodEstimated Value: $527,622 - $581,000
4
Beds
2
Baths
1,553
Sq Ft
$355/Sq Ft
Est. Value
About This Home
This home is located at 19 Sampson St, Methuen, MA 01844 and is currently estimated at $551,406, approximately $355 per square foot. 19 Sampson St is a home located in Essex County with nearby schools including Tenney Grammar School, Methuen High School, and Lawrence Family Development Charter School.
Ownership History
Date
Name
Owned For
Owner Type
Purchase Details
Closed on
Jan 27, 2020
Sold by
Phillips Lauren
Bought by
Phillips Lauren and Phillips Michael
Current Estimated Value
Home Financials for this Owner
Home Financials are based on the most recent Mortgage that was taken out on this home.
Original Mortgage
$302,000
Outstanding Balance
$265,852
Interest Rate
3.74%
Mortgage Type
New Conventional
Estimated Equity
$285,554
Purchase Details
Closed on
Jul 20, 2016
Sold by
Vogel Ft and Vogel
Bought by
Phillips Lauren
Home Financials for this Owner
Home Financials are based on the most recent Mortgage that was taken out on this home.
Original Mortgage
$285,729
Interest Rate
3.6%
Mortgage Type
FHA
Purchase Details
Closed on
Jul 11, 2012
Sold by
Vogel Herbert P and Vogel Fiona M
Bought by
Vogel Ft and Vogel
Create a Home Valuation Report for This Property
The Home Valuation Report is an in-depth analysis detailing your home's value as well as a comparison with similar homes in the area
Home Values in the Area
Average Home Value in this Area
Purchase History
| Date | Buyer | Sale Price | Title Company |
|---|---|---|---|
| Phillips Lauren | -- | None Available | |
| Phillips Lauren | -- | None Available | |
| Phillips Lauren | $291,000 | -- | |
| Vogel Ft | -- | -- | |
| Vogel Ft | -- | -- | |
| Vogel Ft | -- | -- |
Source: Public Records
Mortgage History
| Date | Status | Borrower | Loan Amount |
|---|---|---|---|
| Open | Phillips Lauren | $302,000 | |
| Closed | Phillips Lauren | $302,000 | |
| Previous Owner | Phillips Lauren | $285,729 |
Source: Public Records
Tax History
| Year | Tax Paid | Tax Assessment Tax Assessment Total Assessment is a certain percentage of the fair market value that is determined by local assessors to be the total taxable value of land and additions on the property. | Land | Improvement |
|---|---|---|---|---|
| 2025 | $4,923 | $465,300 | $205,700 | $259,600 |
| 2024 | $4,860 | $447,500 | $187,700 | $259,800 |
| 2023 | $4,611 | $394,100 | $166,800 | $227,300 |
| 2022 | $4,266 | $326,900 | $139,000 | $187,900 |
| 2021 | $4,027 | $305,300 | $132,100 | $173,200 |
| 2020 | $4,004 | $297,900 | $132,100 | $165,800 |
| 2019 | $3,728 | $262,700 | $118,200 | $144,500 |
| 2018 | $3,646 | $255,500 | $118,200 | $137,300 |
| 2017 | $3,528 | $240,800 | $118,200 | $122,600 |
| 2016 | $3,463 | $233,800 | $111,200 | $122,600 |
| 2015 | $3,288 | $225,200 | $111,200 | $114,000 |
Source: Public Records
Map
Nearby Homes
- 16 Green St
- 22 Falcon St
- 65 Clayton Ave
- 76 Haverhill St
- 945 Riverside Dr Unit 8A
- 945 Riverside Dr Unit 3B
- 192 Lowell St
- 35 Maplewood Ave
- 14-16 Cypress Ave
- 13 Caswell Ave
- 1 Perry Ave
- 115-117 Oakland Ave
- 7 Field Ave
- 83 Arnold St
- 20-22 Ashland Ave
- 17 Maguire St
- 20-22 Highgate St
- 12-14 Highgate St
- 1100 Essex St
- 2 Landmark Dr
Your Personal Tour Guide
Ask me questions while you tour the home.