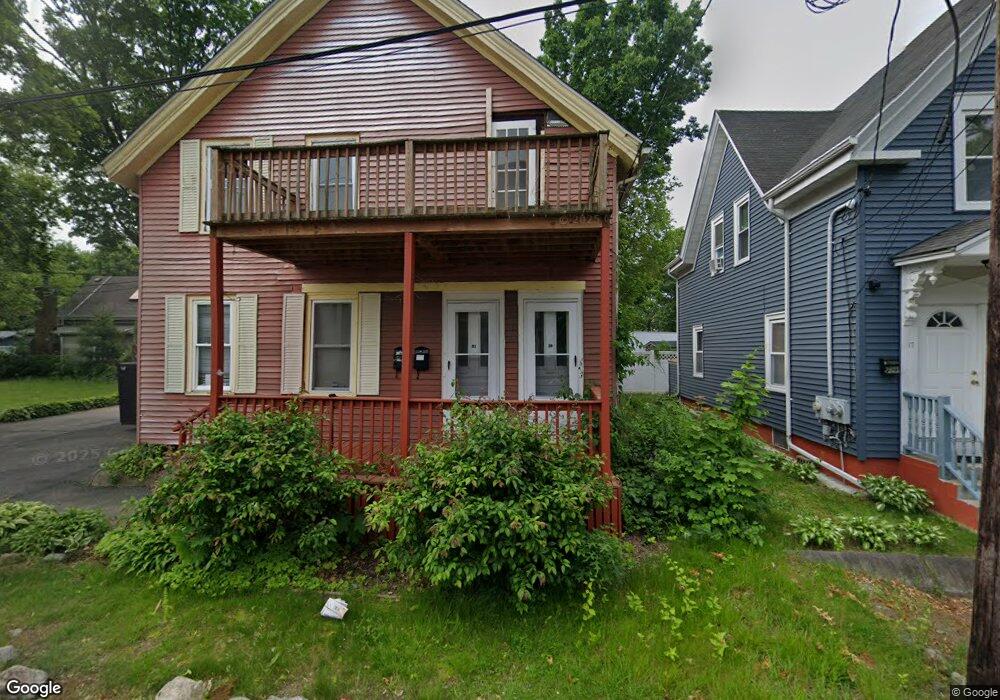
19 Sansom St Unit 2 Brockton, MA 02302
Campello NeighborhoodEstimated Value: $566,000 - $723,000
3
Beds
1
Bath
700
Sq Ft
$891/Sq Ft
Est. Value
About This Home
This home is located at 19 Sansom St Unit 2, Brockton, MA 02302 and is currently estimated at $623,374, approximately $890 per square foot. 19 Sansom St Unit 2 is a home located in Plymouth County with nearby schools including Gilmore Elementary School, Davis K-8 School, and John F. Kennedy Elementary School.
Ownership History
Date
Name
Owned For
Owner Type
Purchase Details
Closed on
May 5, 2025
Sold by
Robinson Corona and Johnson Mary
Bought by
Correia Aline G
Current Estimated Value
Home Financials for this Owner
Home Financials are based on the most recent Mortgage that was taken out on this home.
Original Mortgage
$645,050
Outstanding Balance
$641,618
Interest Rate
6.67%
Mortgage Type
Purchase Money Mortgage
Estimated Equity
-$18,244
Purchase Details
Closed on
Mar 15, 2017
Sold by
Johnson Mary
Bought by
Johnson Mary
Purchase Details
Closed on
Feb 12, 2003
Sold by
Leonard Danielle M and Leonard Michael J
Bought by
Johnson Mary
Home Financials for this Owner
Home Financials are based on the most recent Mortgage that was taken out on this home.
Original Mortgage
$246,137
Interest Rate
5.88%
Mortgage Type
Purchase Money Mortgage
Purchase Details
Closed on
May 30, 1997
Sold by
Department Of Housing & Urban Dev
Bought by
Leonard Danielle M and Leonard Michael J
Purchase Details
Closed on
Feb 7, 1997
Sold by
Pocius Paul E and Usa Hud
Bought by
Department Of Housing & Urban Dev
Purchase Details
Closed on
Jan 30, 1991
Sold by
Panasa Rt
Bought by
Pocius Paul E and Pocius Deborah J
Create a Home Valuation Report for This Property
The Home Valuation Report is an in-depth analysis detailing your home's value as well as a comparison with similar homes in the area
Home Values in the Area
Average Home Value in this Area
Purchase History
| Date | Buyer | Sale Price | Title Company |
|---|---|---|---|
| Correia Aline G | $679,000 | None Available | |
| Correia Aline G | $679,000 | None Available | |
| Johnson Mary | -- | -- | |
| Johnson Mary | -- | -- | |
| Johnson Mary | $250,000 | -- | |
| Johnson Mary | $250,000 | -- | |
| Leonard Danielle M | $78,987 | -- | |
| Leonard Danielle M | $78,987 | -- | |
| Department Of Housing & Urban Dev | $163,944 | -- | |
| Department Of Housing & Urban Dev | $163,944 | -- | |
| Pocius Paul E | $134,400 | -- | |
| Pocius Paul E | $134,400 | -- |
Source: Public Records
Mortgage History
| Date | Status | Borrower | Loan Amount |
|---|---|---|---|
| Open | Correia Aline G | $645,050 | |
| Closed | Correia Aline G | $645,050 | |
| Previous Owner | Pocius Paul E | $246,137 |
Source: Public Records
Tax History
| Year | Tax Paid | Tax Assessment Tax Assessment Total Assessment is a certain percentage of the fair market value that is determined by local assessors to be the total taxable value of land and additions on the property. | Land | Improvement |
|---|---|---|---|---|
| 2025 | $6,927 | $572,000 | $140,600 | $431,400 |
| 2024 | $6,762 | $562,600 | $140,600 | $422,000 |
| 2023 | $6,103 | $470,200 | $106,800 | $363,400 |
| 2022 | $6,324 | $452,700 | $97,100 | $355,600 |
| 2021 | $5,604 | $386,500 | $81,200 | $305,300 |
| 2020 | $5,121 | $338,000 | $75,500 | $262,500 |
| 2019 | $4,841 | $311,500 | $73,500 | $238,000 |
| 2018 | $4,487 | $279,400 | $73,500 | $205,900 |
| 2017 | $4,089 | $254,000 | $73,500 | $180,500 |
| 2016 | $4,345 | $250,300 | $71,400 | $178,900 |
| 2015 | $3,614 | $199,100 | $71,400 | $127,700 |
| 2014 | $3,468 | $191,300 | $71,400 | $119,900 |
Source: Public Records
Map
Nearby Homes
- 41 Riverview St
- 111 Riverview St
- 100 Concord St
- 223 Clinton St Unit 16
- 112 Hillside Ave
- 44 Baker St
- 23 E Chestnut St
- 103 Clinton St
- 28 Wallace St
- 15 Otto St
- 25 Tremont St
- 12 Paulin Ave
- 65 Tremont St
- 202 Summer St
- 936 Warren Ave
- 115 Market St
- 32 Foothill Rd
- 34 Hillberg Ave
- 34 Oakland St
- 99 Tribou St Unit 6
- 21 Sansom St Unit 1
- 17 Sansom St
- 43 Jackson St
- 26 S Leyden St
- 45 Jackson St
- 18 Sansom St
- 28 S Leyden St
- 27 Jackson St
- 22 S Leyden St
- 16 Sansom St
- 188 Perkins Ave
- 188 Perkins Ave Unit 188 Perkins Ave
- 188 Perkins Ave Unit 3
- 194 Perkins Ave
- 14 S Leyden St
- 40 Jackson St
- 198 Perkins Ave
- 182 Perkins Ave
- 17 Jackson St
- 17 Jackson St Unit 2
Your Personal Tour Guide
Ask me questions while you tour the home.