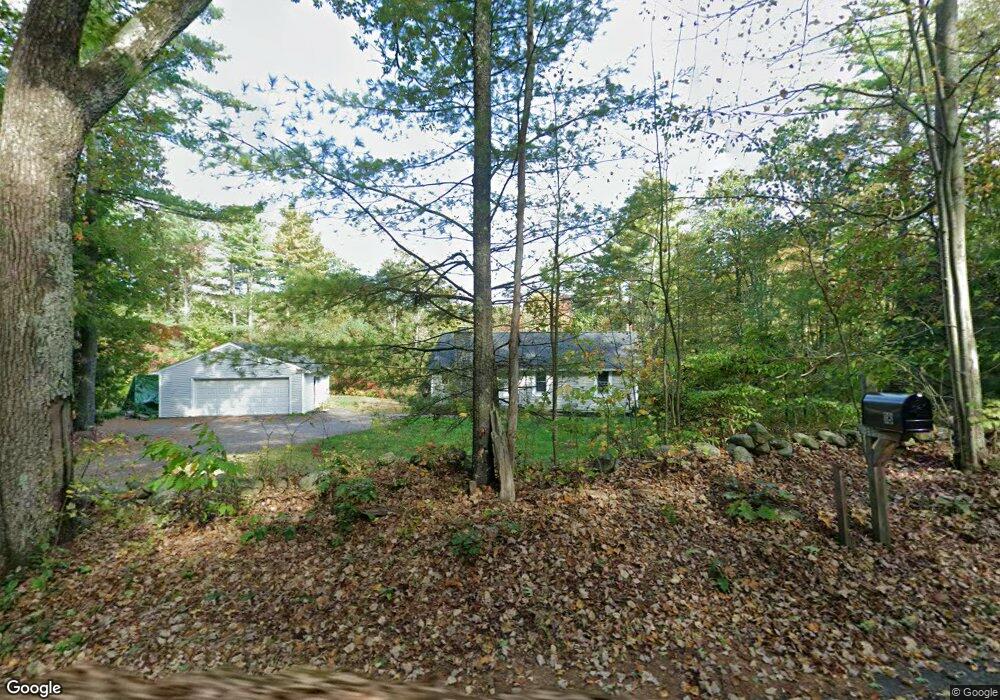
19 Simond Hill Rd Hubbardston, MA 01452
Estimated Value: $396,000 - $446,000
3
Beds
1
Bath
1,008
Sq Ft
$423/Sq Ft
Est. Value
About This Home
This home is located at 19 Simond Hill Rd, Hubbardston, MA 01452 and is currently estimated at $426,520, approximately $423 per square foot. 19 Simond Hill Rd is a home located in Worcester County with nearby schools including Quabbin Regional Middle School and Quabbin Regional High School.
Ownership History
Date
Name
Owned For
Owner Type
Purchase Details
Closed on
Oct 13, 2020
Sold by
Quest T Co
Bought by
See Michael J and See Donna D
Current Estimated Value
Purchase Details
Closed on
Aug 21, 2020
Sold by
Rivard Robert J and Rivard Mary K
Bought by
Quest T Co
Purchase Details
Closed on
Aug 13, 2003
Sold by
Saben John M and Saben Shelley F
Bought by
Rivard Mary K and Rivard Robert J
Home Financials for this Owner
Home Financials are based on the most recent Mortgage that was taken out on this home.
Original Mortgage
$120,000
Interest Rate
5.46%
Mortgage Type
Purchase Money Mortgage
Purchase Details
Closed on
Apr 12, 2000
Sold by
Benoit Jeffrey E
Bought by
Saben John M and Fortin-Saben Shelly F
Home Financials for this Owner
Home Financials are based on the most recent Mortgage that was taken out on this home.
Original Mortgage
$95,920
Interest Rate
8.26%
Mortgage Type
Purchase Money Mortgage
Create a Home Valuation Report for This Property
The Home Valuation Report is an in-depth analysis detailing your home's value as well as a comparison with similar homes in the area
Home Values in the Area
Average Home Value in this Area
Purchase History
| Date | Buyer | Sale Price | Title Company |
|---|---|---|---|
| See Michael J | $286,500 | None Available | |
| Quest T Co | $160,000 | None Available | |
| Rivard Mary K | $198,900 | -- | |
| Saben John M | $119,900 | -- |
Source: Public Records
Mortgage History
| Date | Status | Borrower | Loan Amount |
|---|---|---|---|
| Previous Owner | Rivard Mary K | $120,000 | |
| Previous Owner | Saben John M | $5,000 | |
| Previous Owner | Saben John M | $112,500 | |
| Previous Owner | Saben John M | $95,920 |
Source: Public Records
Tax History Compared to Growth
Tax History
| Year | Tax Paid | Tax Assessment Tax Assessment Total Assessment is a certain percentage of the fair market value that is determined by local assessors to be the total taxable value of land and additions on the property. | Land | Improvement |
|---|---|---|---|---|
| 2025 | $4,218 | $361,100 | $49,600 | $311,500 |
| 2024 | $3,386 | $287,200 | $44,800 | $242,400 |
| 2023 | $2,963 | $227,400 | $39,200 | $188,200 |
| 2022 | $3,184 | $227,400 | $39,200 | $188,200 |
| 2021 | $3,400 | $229,600 | $39,200 | $190,400 |
| 2020 | $3,294 | $222,300 | $39,200 | $183,100 |
| 2019 | $3,205 | $210,600 | $53,600 | $157,000 |
| 2018 | $3,029 | $200,200 | $53,600 | $146,600 |
| 2017 | $3,049 | $200,200 | $53,600 | $146,600 |
| 2016 | $2,617 | $164,600 | $53,600 | $111,000 |
| 2015 | $2,633 | $176,500 | $53,600 | $122,900 |
| 2014 | $2,621 | $180,500 | $53,600 | $126,900 |
Source: Public Records
Map
Nearby Homes
- 1 Barre Road Cut Off
- 56 Hubbardston Rd
- 75 Barre Rd
- Lot 0 Old Westminster Rd
- 7 Williamsville Rd
- 63 Gardner Rd
- 105 Hale Rd
- 81 Glenwood Place
- 271 Glenwood Rd
- 2 Simon Davis Dr
- 35 Brintnal Dr
- 134 Mountain Rd
- 175 Glenwood Rd
- 73 Brintnal Dr
- 101 Brintnal Dr
- 166 Ball Hill Rd
- 207 W Princeton Rd
- 20 Mountain Rd
- 62 Bolton Rd Unit Applewood
- 40 Brunelle Dr
- 19 Simond Hill Rd
- 21 Simond Hill Rd
- 21 Simonds Hill Rd
- 17 Simond Hill Rd
- 16 Simond Hill Rd
- 18 Simonds Hill Rd
- 50 Simonds Hill Rd
- 20 Simond Hill Rd
- 12 Simond Hill Rd
- 23 Simond Hill Rd
- Lot 1B Simond Hill Rd
- 24 Simonds Hill Rd
- 25 Simonds Hill Rd
- 102 Old Princeton Rd
- 104 Old Princeton Rd
- 100 Old Princeton Rd
- 9 Simond Hill Rd
- 98 Old Princeton Rd
- 26 Simonds Hill Rd
- 106 Old Princeton Rd